|
Download Data (XLS File) |
|
||||||||
|
||||||||
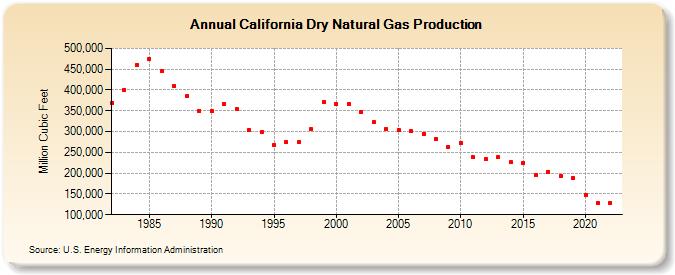
| California Dry Natural Gas Production (Million Cubic Feet) | ||||||||
| Decade | Year-0 | Year-1 | Year-2 | Year-3 | Year-4 | Year-5 | Year-6 | Year-7 | Year-8 | Year-9 |
|---|---|---|---|---|---|---|---|---|---|---|
| 1980's | 369,864 | 400,381 | 460,891 | 474,310 | 446,015 | 409,619 | 384,771 | 349,484 | ||
| 1990's | 350,324 | 366,598 | 353,247 | 303,798 | 298,177 | 268,046 | 274,325 | 274,090 | 305,035 | 371,953 |
| 2000's | 365,517 | 366,764 | 347,223 | 323,245 | 305,858 | 303,889 | 301,153 | 293,639 | 282,497 | 262,853 |
| 2010's | 273,597 | 238,082 | 234,067 | 238,012 | 225,787 | 224,178 | 194,428 | 202,993 | 193,220 | 188,090 |
| 2020's | 148,141 | 128,566 | 129,305 |
| - = No Data Reported; -- = Not Applicable; NA = Not Available; W = Withheld to avoid disclosure of individual company data. |
| Release Date: 3/29/2024 |
| Next Release Date: 4/30/2024 |