|
Download Data (XLS File) |
|
||||||||
|
||||||||
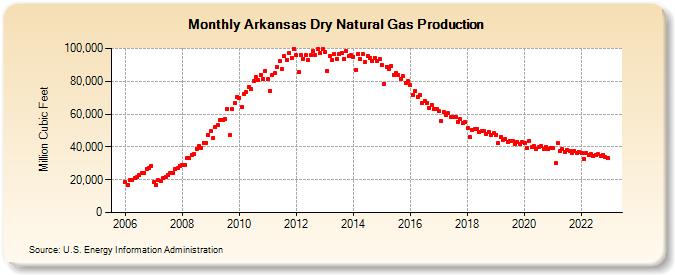
| Arkansas Dry Natural Gas Production (Million Cubic Feet) | ||||||||
| Year | Jan | Feb | Mar | Apr | May | Jun | Jul | Aug | Sep | Oct | Nov | Dec |
|---|---|---|---|---|---|---|---|---|---|---|---|---|
| 2006 | 18,546 | 16,947 | 19,757 | 19,566 | 21,048 | 21,471 | 22,642 | 23,956 | 24,198 | 26,472 | 26,928 | 28,550 |
| 2007 | 18,430 | 16,848 | 19,649 | 19,459 | 21,011 | 21,441 | 22,595 | 23,921 | 24,250 | 26,634 | 26,925 | 28,562 |
| 2008 | 29,068 | 29,082 | 32,973 | 33,043 | 35,331 | 35,806 | 38,869 | 40,631 | 39,412 | 42,558 | 42,579 | 46,966 |
| 2009 | 49,673 | 45,476 | 51,973 | 53,142 | 56,218 | 56,255 | 56,932 | 63,384 | 47,067 | 62,797 | 66,448 | 70,419 |
| 2010 | 70,073 | 64,169 | 72,458 | 73,424 | 76,475 | 75,411 | 79,934 | 82,380 | 80,488 | 83,809 | 81,415 | 86,390 |
| 2011 | 81,082 | 74,261 | 83,854 | 84,964 | 88,515 | 92,249 | 87,539 | 95,303 | 93,123 | 96,950 | 94,177 | 99,928 |
| 2012 | 95,797 | 85,615 | 95,788 | 93,716 | 95,878 | 92,884 | 95,721 | 98,326 | 96,018 | 99,539 | 97,008 | 99,455 |
| 2013 | 97,698 | 86,493 | 95,179 | 92,908 | 96,837 | 93,624 | 96,429 | 97,225 | 93,625 | 98,301 | 95,106 | 95,743 |
| 2014 | 94,822 | 86,741 | 96,472 | 93,328 | 96,690 | 91,974 | 95,424 | 94,332 | 92,041 | 94,361 | 92,439 | 93,527 |
| 2015 | 90,079 | 78,202 | 88,848 | 87,222 | 89,344 | 84,079 | 85,234 | 83,650 | 81,208 | 82,927 | 78,932 | 80,106 |
| 2016 | 77,557 | 71,625 | 74,211 | 70,470 | 71,520 | 67,040 | 67,974 | 66,924 | 63,956 | 65,675 | 62,793 | 63,041 |
| 2017 | 61,559 | 55,865 | 61,258 | 59,308 | 60,547 | 57,943 | 58,404 | 57,969 | 55,410 | 56,788 | 54,286 | 54,962 |
| 2018 | 51,277 | 46,173 | 50,546 | 50,835 | 51,006 | 48,792 | 49,395 | 49,533 | 47,615 | 49,110 | 47,233 | 48,187 |
| 2019 | 47,422 | 42,200 | 46,190 | 44,435 | 44,885 | 42,681 | 43,831 | 43,483 | 41,777 | 43,071 | 41,716 | 42,811 |
| 2020 | 42,184 | 39,093 | 43,654 | 39,748 | 40,473 | 38,743 | 39,858 | 40,302 | 38,741 | 40,179 | 38,567 | 39,452 |
| 2021 | 39,272 | 30,171 | 42,451 | 37,739 | 38,546 | 36,904 | 38,030 | 37,738 | 36,510 | 37,631 | 36,084 | 37,005 |
| 2022 | 36,072 | 32,323 | 36,304 | 35,028 | 35,765 | 34,284 | 35,080 | 35,378 | 34,196 | 35,096 | 33,553 | 32,935 |
| - = No Data Reported; -- = Not Applicable; NA = Not Available; W = Withheld to avoid disclosure of individual company data. |
| Release Date: 3/29/2024 |
| Next Release Date: 4/30/2024 |