|
Download Data (XLS File) |
|
||||||||
|
||||||||
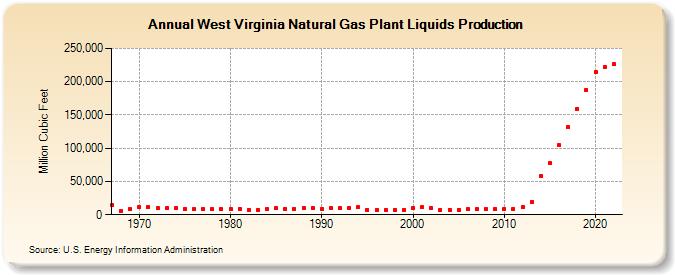
| West Virginia Natural Gas Plant Liquids Production (Million Cubic Feet) | ||||||||
| Decade | Year-0 | Year-1 | Year-2 | Year-3 | Year-4 | Year-5 | Year-6 | Year-7 | Year-8 | Year-9 |
|---|---|---|---|---|---|---|---|---|---|---|
| 1960's | 14,150 | 6,024 | 8,439 | |||||||
| 1970's | 11,062 | 10,939 | 9,411 | 9,428 | 9,605 | 9,258 | 8,284 | 8,504 | 8,518 | 7,973 |
| 1980's | 8,786 | 9,060 | 7,086 | 7,505 | 8,638 | 9,590 | 8,681 | 8,830 | 9,839 | 10,121 |
| 1990's | 9,108 | 9,745 | 9,436 | 10,830 | 10,901 | 7,396 | 7,093 | 7,179 | 7,337 | 7,334 |
| 2000's | 10,398 | 11,094 | 9,960 | 7,226 | 7,656 | 7,675 | 8,017 | 8,071 | 8,391 | 8,786 |
| 2010's | 8,607 | 8,627 | 10,888 | 19,564 | 57,582 | 77,539 | 104,251 | 131,441 | 158,937 | 188,135 |
| 2020's | 214,284 | 222,759 | 225,932 |
| - = No Data Reported; -- = Not Applicable; NA = Not Available; W = Withheld to avoid disclosure of individual company data. |
| Release Date: 3/29/2024 |
| Next Release Date: 4/30/2024 |