|
Download Data (XLS File) |
|
|||||
|
|||||
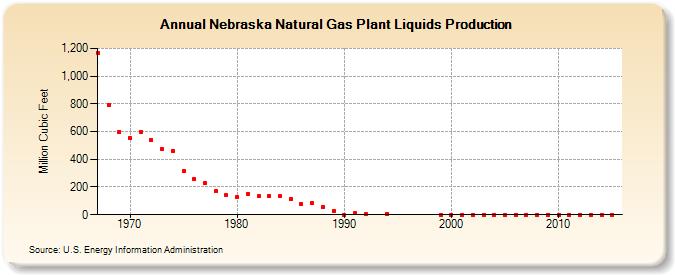
| Nebraska Natural Gas Plant Liquids Production (Million Cubic Feet) | |||||
| Decade | Year-0 | Year-1 | Year-2 | Year-3 | Year-4 | Year-5 | Year-6 | Year-7 | Year-8 | Year-9 |
|---|---|---|---|---|---|---|---|---|---|---|
| 1960's | 1,170 | 794 | 598 | |||||||
| 1970's | 555 | 599 | 539 | 474 | 460 | 313 | 259 | 226 | 168 | 139 |
| 1980's | 126 | 153 | 133 | 137 | 132 | 115 | 77 | 81 | 59 | 29 |
| 1990's | 0 | 13 | 3 | 8 | 0 | |||||
| 2000's | 0 | 0 | 0 | 0 | 0 | 0 | 0 | 0 | 0 | 0 |
| 2010's | 0 | 0 | 0 | 0 | 0 | 0 |
| - = No Data Reported; -- = Not Applicable; NA = Not Available; W = Withheld to avoid disclosure of individual company data. |
| Release Date: 3/29/2024 |
| Next Release Date: 4/30/2024 |