|
Download Data (XLS File) |
|
||||||||
|
||||||||
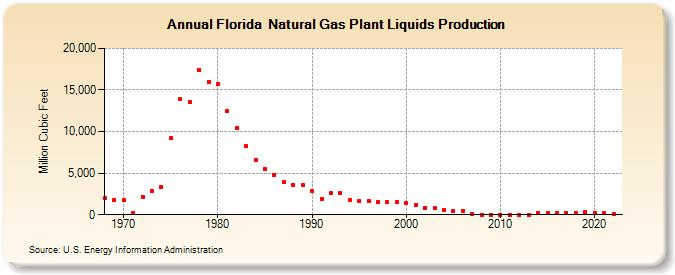
| Florida Natural Gas Plant Liquids Production (Million Cubic Feet) | ||||||||
| Decade | Year-0 | Year-1 | Year-2 | Year-3 | Year-4 | Year-5 | Year-6 | Year-7 | Year-8 | Year-9 |
|---|---|---|---|---|---|---|---|---|---|---|
| 1960's | 2,010 | 1,723 | ||||||||
| 1970's | 1,829 | 180 | 2,144 | 2,886 | 3,369 | 9,170 | 13,865 | 13,534 | 17,436 | 15,954 |
| 1980's | 15,740 | 12,478 | 10,453 | 8,269 | 6,631 | 5,471 | 4,802 | 3,884 | 3,584 | 3,551 |
| 1990's | 2,831 | 1,893 | 2,563 | 2,557 | 1,789 | 1,630 | 1,649 | 1,563 | 1,523 | 1,557 |
| 2000's | 1,354 | 1,159 | 855 | 771 | 618 | 495 | 485 | 132 | 22 | 0 |
| 2010's | 0 | 0 | 0 | 0 | 233 | 235 | 220 | 208 | 212 | 290 |
| 2020's | 217 | 177 | 142 |
| - = No Data Reported; -- = Not Applicable; NA = Not Available; W = Withheld to avoid disclosure of individual company data. |
| Release Date: 3/29/2024 |
| Next Release Date: 4/30/2024 |