|
Download Data (XLS File) |
|
|||||
|
|||||
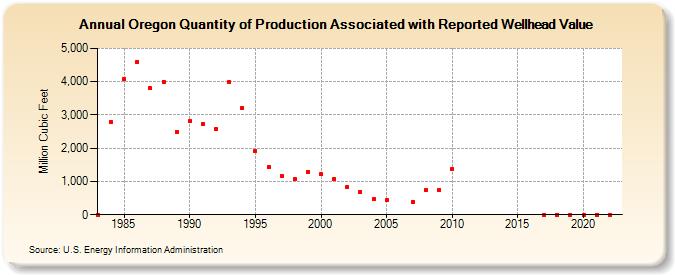
| Oregon Quantity of Production Associated with Reported Wellhead Value (Million Cubic Feet) | |||||
| Decade | Year-0 | Year-1 | Year-2 | Year-3 | Year-4 | Year-5 | Year-6 | Year-7 | Year-8 | Year-9 |
|---|---|---|---|---|---|---|---|---|---|---|
| 1980's | 3 | 2,790 | 4,080 | 4,600 | 3,800 | 4,000 | 2,500 | |||
| 1990's | 2,815 | 2,741 | 2,580 | 4,003 | 3,221 | 1,923 | 1,439 | 1,173 | 1,067 | 1,291 |
| 2000's | 1,214 | 1,069 | 837 | 688 | 467 | 433 | NA | 390 | 751 | 751 |
| 2010's | 1,376 | 0 | 0 | 0 | ||||||
| 2020's | 0 | 0 |
| - = No Data Reported; -- = Not Applicable; NA = Not Available; W = Withheld to avoid disclosure of individual company data. |
| Release Date: 3/29/2024 |
| Next Release Date: 4/30/2024 |