|
Download Data (XLS File) |
|
|||||
|
|||||
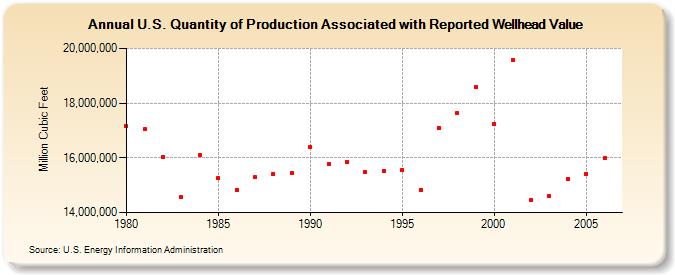
| U.S. Quantity of Production Associated with Reported Wellhead Value (Million Cubic Feet) | |||||
| Decade | Year-0 | Year-1 | Year-2 | Year-3 | Year-4 | Year-5 | Year-6 | Year-7 | Year-8 | Year-9 |
|---|---|---|---|---|---|---|---|---|---|---|
| 1980's | 17,159,365 | 17,042,578 | 16,025,662 | 14,556,226 | 16,121,625 | 15,247,466 | 14,823,587 | 15,283,764 | 15,419,723 | 15,432,773 |
| 1990's | 16,408,437 | 15,770,393 | 15,852,090 | 15,480,352 | 15,513,667 | 15,557,464 | 14,822,258 | 17,105,855 | 17,653,795 | 18,595,208 |
| 2000's | 17,251,333 | 19,577,660 | 14,467,289 | 14,589,545 | 15,223,749 | 15,425,867 | 15,981,421 |
| - = No Data Reported; -- = Not Applicable; NA = Not Available; W = Withheld to avoid disclosure of individual company data. |
| Release Date: 3/29/2024 |
| Next Release Date: 4/30/2024 |