|
Download Data (XLS File) |
|
|||||
|
|||||
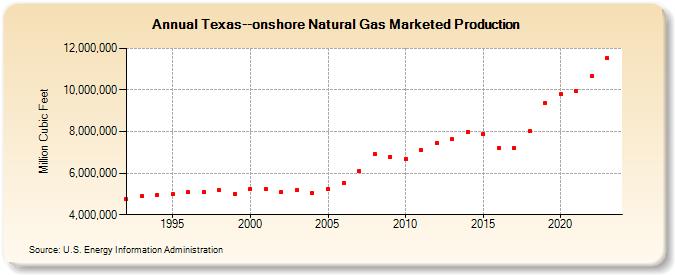
| Texas--onshore Natural Gas Marketed Production (Million Cubic Feet) | |||||
| Decade | Year-0 | Year-1 | Year-2 | Year-3 | Year-4 | Year-5 | Year-6 | Year-7 | Year-8 | Year-9 |
|---|---|---|---|---|---|---|---|---|---|---|
| 1990's | 4,734,715 | 4,894,291 | 4,961,117 | 4,983,373 | 5,068,868 | 5,102,806 | 5,167,180 | 5,005,568 | ||
| 2000's | 5,240,909 | 5,229,075 | 5,084,012 | 5,189,998 | 5,022,369 | 5,239,469 | 5,523,237 | 6,093,951 | 6,913,906 | 6,781,162 |
| 2010's | 6,686,719 | 7,089,072 | 7,458,989 | 7,619,582 | 7,973,818 | 7,881,157 | 7,217,930 | 7,218,863 | 8,037,539 | 9,375,530 |
| 2020's | 9,810,701 | 9,947,857 | 10,826,569 |
| - = No Data Reported; -- = Not Applicable; NA = Not Available; W = Withheld to avoid disclosure of individual company data. |
| Release Date: 8/30/2024 |
| Next Release Date: 9/30/2024 |