|
Download Data (XLS File) |
|
|||||
|
|||||
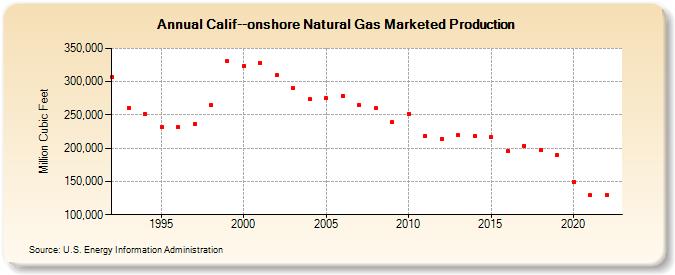
| Calif--onshore Natural Gas Marketed Production (Million Cubic Feet) | |||||
| Decade | Year-0 | Year-1 | Year-2 | Year-3 | Year-4 | Year-5 | Year-6 | Year-7 | Year-8 | Year-9 |
|---|---|---|---|---|---|---|---|---|---|---|
| 1990's | 306,829 | 260,560 | 251,390 | 232,005 | 231,640 | 236,725 | 264,610 | 330,370 | ||
| 2000's | 323,864 | 328,778 | 309,399 | 290,212 | 273,232 | 274,817 | 278,933 | 264,838 | 259,988 | 239,037 |
| 2010's | 251,559 | 218,638 | 214,509 | 219,386 | 218,668 | 216,772 | 196,041 | 203,979 | 197,790 | 189,827 |
| 2020's | 149,829 | 129,159 | 129,918 |
| - = No Data Reported; -- = Not Applicable; NA = Not Available; W = Withheld to avoid disclosure of individual company data. |
| Release Date: 4/30/2024 |
| Next Release Date: 5/31/2024 |