|
Download Data (XLS File) |
|
|||||
|
|||||
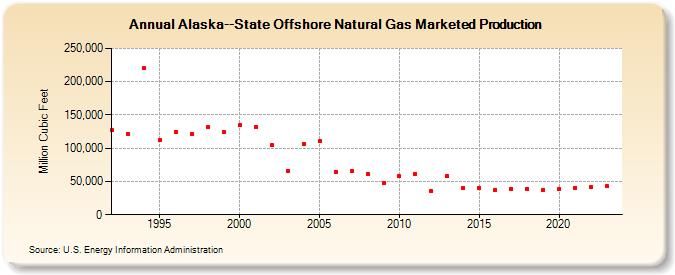
| Alaska--State Offshore Natural Gas Marketed Production (Million Cubic Feet) | |||||
| Decade | Year-0 | Year-1 | Year-2 | Year-3 | Year-4 | Year-5 | Year-6 | Year-7 | Year-8 | Year-9 |
|---|---|---|---|---|---|---|---|---|---|---|
| 1990's | 127,142 | 121,838 | 219,794 | 111,920 | 124,922 | 121,986 | 131,222 | 124,161 | ||
| 2000's | 134,418 | 132,130 | 104,366 | 66,391 | 106,799 | 110,390 | 64,503 | 65,141 | 61,084 | 47,620 |
| 2010's | 57,680 | 61,496 | 35,577 | 58,081 | 40,267 | 40,207 | 37,285 | 39,133 | 39,116 | 37,317 |
| 2020's | 38,538 | 40,470 | 41,195 |
| - = No Data Reported; -- = Not Applicable; NA = Not Available; W = Withheld to avoid disclosure of individual company data. |
| Release Date: 3/29/2024 |
| Next Release Date: 4/30/2024 |