|
Download Data (XLS File) |
|
|||||
|
|||||
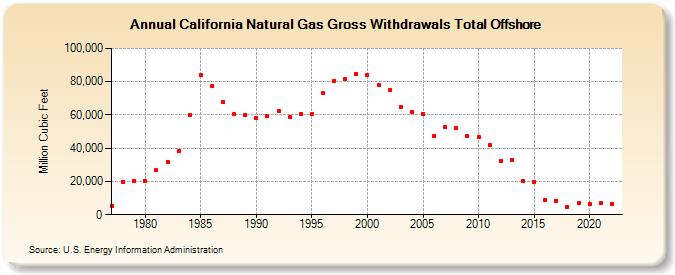
| California Natural Gas Gross Withdrawals Total Offshore (Million Cubic Feet) | |||||
| Decade | Year-0 | Year-1 | Year-2 | Year-3 | Year-4 | Year-5 | Year-6 | Year-7 | Year-8 | Year-9 |
|---|---|---|---|---|---|---|---|---|---|---|
| 1970's | 5,417 | 19,929 | 20,394 | |||||||
| 1980's | 19,980 | 26,692 | 31,904 | 38,084 | 60,207 | 84,062 | 77,355 | 67,835 | 60,308 | 59,889 |
| 1990's | 58,055 | 59,465 | 62,473 | 58,635 | 60,765 | 60,694 | 73,092 | 80,516 | 81,868 | 84,547 |
| 2000's | 83,882 | 78,209 | 74,884 | 64,961 | 61,622 | 60,773 | 47,217 | 52,805 | 51,931 | 47,281 |
| 2010's | 46,755 | 41,742 | 32,313 | 32,924 | 20,320 | 19,877 | 8,984 | 8,480 | 4,827 | 6,995 |
| 2020's | 6,518 | 6,921 | 6,346 |
| - = No Data Reported; -- = Not Applicable; NA = Not Available; W = Withheld to avoid disclosure of individual company data. |
| Release Date: 4/30/2024 |
| Next Release Date: 5/31/2024 |