|
Download Data (XLS File) |
|
|||||
|
|||||
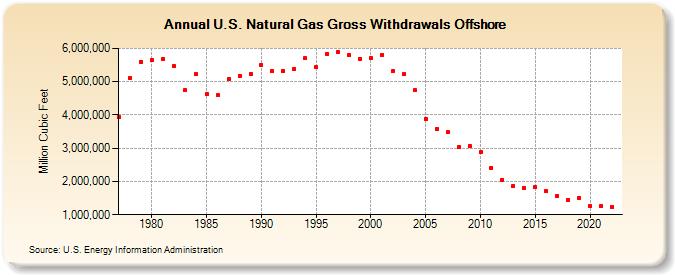
| U.S. Natural Gas Gross Withdrawals Offshore (Million Cubic Feet) | |||||
| Decade | Year-0 | Year-1 | Year-2 | Year-3 | Year-4 | Year-5 | Year-6 | Year-7 | Year-8 | Year-9 |
|---|---|---|---|---|---|---|---|---|---|---|
| 1970's | 3,932,196 | 5,111,413 | 5,603,025 | |||||||
| 1980's | 5,650,097 | 5,693,432 | 5,466,050 | 4,734,843 | 5,220,061 | 4,631,756 | 4,588,565 | 5,078,178 | 5,180,875 | 5,231,028 |
| 1990's | 5,509,312 | 5,308,457 | 5,324,039 | 5,373,300 | 5,700,666 | 5,431,665 | 5,843,661 | 5,906,329 | 5,800,561 | 5,689,438 |
| 2000's | 5,699,377 | 5,815,542 | 5,312,348 | 5,215,683 | 4,736,252 | 3,889,577 | 3,584,190 | 3,476,755 | 3,028,561 | 3,072,285 |
| 2010's | 2,875,945 | 2,416,644 | 2,044,643 | 1,859,469 | 1,804,544 | 1,825,337 | 1,709,055 | 1,556,679 | 1,456,967 | 1,494,960 |
| 2020's | 1,275,454 | 1,260,788 | 1,243,429 | 1,205,866 |
| - = No Data Reported; -- = Not Applicable; NA = Not Available; W = Withheld to avoid disclosure of individual company data. |
| Release Date: 6/30/2025 |
| Next Release Date: 7/31/2025 |