|
Download Data (XLS File) |
|
|||||
|
|||||
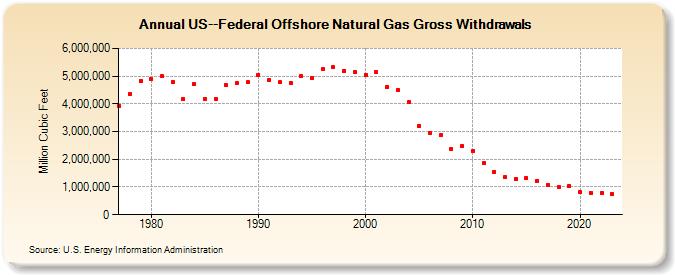
| US--Federal Offshore Natural Gas Gross Withdrawals (Million Cubic Feet) | |||||
| Decade | Year-0 | Year-1 | Year-2 | Year-3 | Year-4 | Year-5 | Year-6 | Year-7 | Year-8 | Year-9 |
|---|---|---|---|---|---|---|---|---|---|---|
| 1970's | 3,932,196 | 4,355,742 | 4,822,114 | |||||||
| 1980's | 4,902,354 | 4,990,667 | 4,772,873 | 4,182,233 | 4,706,782 | 4,185,519 | 4,185,515 | 4,671,801 | 4,746,664 | 4,771,411 |
| 1990's | 5,046,660 | 4,849,657 | 4,771,744 | 4,765,865 | 4,996,197 | 4,942,089 | 5,246,422 | 5,315,514 | 5,185,312 | 5,130,746 |
| 2000's | 5,043,769 | 5,136,962 | 4,615,443 | 4,505,443 | 4,055,340 | 3,204,906 | 2,954,538 | 2,858,713 | 2,374,857 | 2,485,331 |
| 2010's | 2,300,344 | 1,867,492 | 1,555,138 | 1,354,151 | 1,290,253 | 1,322,389 | 1,225,155 | 1,082,168 | 996,132 | 1,036,914 |
| 2020's | 809,044 | 794,834 | 786,971 |
| - = No Data Reported; -- = Not Applicable; NA = Not Available; W = Withheld to avoid disclosure of individual company data. |
| Release Date: 4/30/2024 |
| Next Release Date: 5/31/2024 |