|
Download Data (XLS File) |
|
|||||
|
|||||
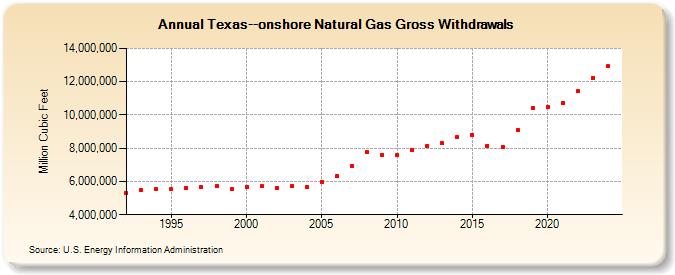
| Texas--onshore Natural Gas Gross Withdrawals (Million Cubic Feet) | |||||
| Decade | Year-0 | Year-1 | Year-2 | Year-3 | Year-4 | Year-5 | Year-6 | Year-7 | Year-8 | Year-9 |
|---|---|---|---|---|---|---|---|---|---|---|
| 1990's | 5,296,865 | 5,461,594 | 5,518,978 | 5,525,982 | 5,626,448 | 5,665,074 | 5,738,595 | 5,526,033 | ||
| 2000's | 5,681,726 | 5,698,798 | 5,603,941 | 5,737,755 | 5,688,972 | 5,969,905 | 6,301,649 | 6,931,629 | 7,753,869 | 7,615,836 |
| 2010's | 7,565,123 | 7,910,898 | 8,127,004 | 8,285,436 | 8,647,988 | 8,790,163 | 8,148,755 | 8,074,996 | 9,105,249 | 10,429,209 |
| 2020's | 10,487,237 | 10,741,703 | 11,600,439 |
| - = No Data Reported; -- = Not Applicable; NA = Not Available; W = Withheld to avoid disclosure of individual company data. |
| Release Date: 3/29/2024 |
| Next Release Date: 4/30/2024 |