|
Download Data (XLS File) |
|
||||||||
|
||||||||
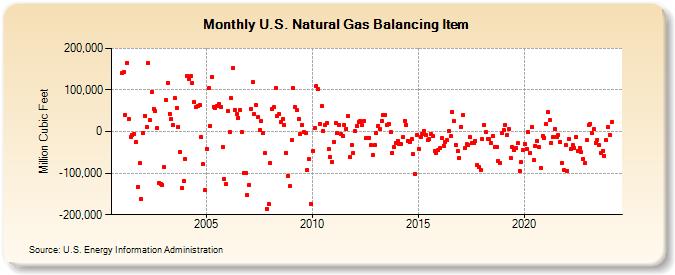
| U.S. Natural Gas Balancing Item (Million Cubic Feet) | ||||||||
| Year | Jan | Feb | Mar | Apr | May | Jun | Jul | Aug | Sep | Oct | Nov | Dec |
|---|---|---|---|---|---|---|---|---|---|---|---|---|
| 2001 | 140,457 | 143,420 | 40,508 | 165,589 | 29,670 | -12,687 | -7,522 | -5,639 | -25,646 | -132,631 | -75,869 | -161,019 |
| 2002 | -4,043 | 38,079 | 11,261 | 164,421 | 28,047 | 94,698 | 54,263 | 49,349 | 7,788 | -124,023 | -126,334 | -128,599 |
| 2003 | -85,911 | 76,412 | 117,834 | 42,839 | 29,671 | 16,325 | 80,113 | 57,301 | 11,671 | -49,115 | -135,623 | -117,899 |
| 2004 | -66,341 | 134,281 | 125,684 | 132,567 | 116,388 | 71,221 | 58,237 | 60,432 | 62,797 | -13,466 | -78,965 | -141,694 |
| 2005 | -41,225 | 103,738 | 14,442 | 131,451 | 60,083 | 57,514 | 61,979 | 66,272 | 59,149 | -37,020 | -113,596 | -126,688 |
| 2006 | 48,638 | -1,606 | 80,391 | 152,253 | 52,653 | 41,197 | 33,549 | 50,867 | -2,213 | -98,818 | -100,857 | -152,624 |
| 2007 | -127,938 | 54,971 | 118,085 | 42,198 | 63,360 | 34,036 | 3,345 | 24,484 | -3,493 | -51,690 | -185,147 | -174,784 |
| 2008 | -75,438 | 54,266 | 58,678 | 104,609 | 38,421 | 41,727 | 23,378 | 29,412 | 16,098 | -50,891 | -105,868 | -131,988 |
| 2009 | -20,885 | 103,958 | 59,013 | 51,773 | 29,910 | -6,991 | 16,818 | -1,175 | -4,624 | -91,760 | -66,254 | -173,213 |
| 2010 | -46,217 | 8,865 | 108,642 | 101,633 | 18,856 | 61,216 | 2,437 | 15,600 | 21,112 | -42,314 | -61,459 | -72,897 |
| 2011 | -24,370 | 20,482 | -4,308 | 16,574 | -6,536 | -11,184 | 16,744 | 7,289 | 36,333 | -61,240 | -32,278 | -51,106 |
| 2012 | 783 | 12,447 | 22,483 | 25,381 | 14,570 | 25,760 | -16,321 | -14,486 | -14,607 | -33,521 | -56,085 | -32,739 |
| 2013 | -4,562 | 13,831 | 6,743 | 25,773 | 39,351 | 40,558 | 14,762 | 19,274 | -1,099 | -51,249 | -38,344 | -27,239 |
| 2014 | -23,090 | -29,277 | -29,626 | -14,180 | 26,056 | 15,917 | -21,791 | -25,567 | -18,067 | -55,033 | -101,640 | -7,194 |
| 2015 | -42,280 | -12,465 | -5,961 | 1,328 | -7,645 | -21,485 | -18,562 | -6,684 | -11,321 | -46,727 | -51,118 | -44,988 |
| 2016 | -39,772 | -16,015 | -33,717 | -25,042 | -21,156 | 888 | -11,234 | 47,777 | 25,089 | -32,320 | -47,567 | -63,412 |
| 2017 | 12,150 | 39,072 | -39,049 | -30,942 | -32,170 | -13,317 | -27,520 | -26,329 | -22,009 | -79,890 | -84,079 | -93,236 |
| 2018 | -18,696 | 16,027 | -1,968 | -16,857 | -18,222 | -27,325 | -11,836 | -36,085 | -37,007 | -69,668 | -74,890 | -3,428 |
| 2019 | 4,137 | 15,544 | -7,740 | 7,223 | -63,383 | -37,040 | -44,846 | -40,383 | -28,385 | -94,255 | -73,759 | -45,485 |
| 2020 | -29,034 | -41,483 | -2,111 | -50,412 | 10,814 | -68,671 | -34,037 | -22,070 | -37,047 | -87,611 | -10,640 | -14,458 |
| 2021 | 18,446 | 46,392 | 27,261 | -26,884 | -13,032 | 5,668 | -12,417 | -8,578 | -24,801 | -75,381 | -91,905 | -32,762 |
| 2022 | -94,521 | -17,483 | -43,039 | -32,508 | -39,020 | -12,794 | -45,856 | -39,262 | -50,371 | -65,733 | -76,644 | -21,461 |
| 2023 | 16,679 | 17,606 | -6,045 | 5,178 | -26,855 | -22,234 | -33,924 | -50,025 | -46,448 | -57,509 | -20,226 | 6,714 |
| 2024 | -4,648 | |||||||||||
| - = No Data Reported; -- = Not Applicable; NA = Not Available; W = Withheld to avoid disclosure of individual company data. |
| Release Date: 3/29/2024 |
| Next Release Date: 4/30/2024 |