|
Download Data (XLS File) |
|
||||||||
|
||||||||
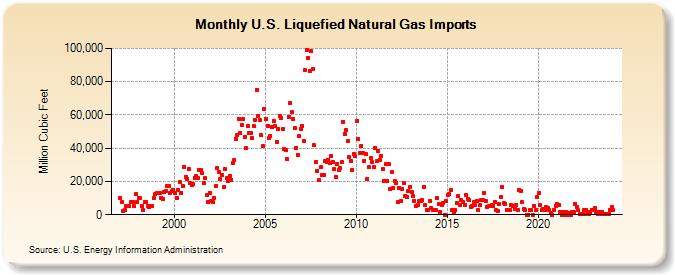
| U.S. Liquefied Natural Gas Imports (Million Cubic Feet) | ||||||||
| Year | Jan | Feb | Mar | Apr | May | Jun | Jul | Aug | Sep | Oct | Nov | Dec |
|---|---|---|---|---|---|---|---|---|---|---|---|---|
| 1997 | 9,977 | 7,667 | 2,530 | 2,557 | 5,007 | 5,059 | 5,026 | 7,535 | 7,367 | 5,050 | 12,435 | 7,567 |
| 1998 | 10,105 | 9,777 | 5,166 | 2,549 | 7,596 | 7,590 | 5,086 | 4,862 | 5,133 | 5,023 | 10,062 | 12,504 |
| 1999 | 13,066 | 12,888 | 13,090 | 10,129 | 9,391 | 13,878 | 14,121 | 17,336 | 16,973 | 13,292 | 14,175 | 15,091 |
| 2000 | 12,806 | 10,155 | 14,812 | 19,378 | 13,176 | 17,517 | 28,906 | 22,943 | 21,713 | 27,390 | 19,192 | 18,049 |
| 2001 | 18,204 | 22,099 | 23,245 | 22,013 | 27,144 | 26,589 | 25,099 | 19,118 | 21,827 | 11,725 | 7,850 | 13,212 |
| 2002 | 8,043 | 7,571 | 10,151 | 17,213 | 28,092 | 25,824 | 21,400 | 24,174 | 16,886 | 27,421 | 21,804 | 20,147 |
| 2003 | 23,113 | 21,007 | 31,002 | 32,682 | 45,814 | 47,914 | 57,803 | 49,012 | 53,835 | 57,523 | 46,743 | 40,072 |
| 2004 | 53,413 | 48,959 | 49,033 | 46,061 | 53,162 | 57,190 | 75,090 | 59,504 | 57,038 | 47,748 | 41,179 | 63,638 |
| 2005 | 57,829 | 53,538 | 45,885 | 47,567 | 52,628 | 56,377 | 53,141 | 43,630 | 51,824 | 59,576 | 57,977 | 51,288 |
| 2006 | 39,466 | 38,737 | 33,228 | 58,792 | 67,271 | 61,705 | 57,550 | 52,122 | 40,004 | 36,185 | 47,236 | 51,240 |
| 2007 | 53,441 | 44,101 | 86,848 | 98,742 | 94,319 | 86,587 | 98,344 | 87,471 | 41,654 | 31,939 | 26,539 | 20,826 |
| 2008 | 28,414 | 23,599 | 23,707 | 32,218 | 31,597 | 33,073 | 31,019 | 35,380 | 31,767 | 27,415 | 22,802 | 30,708 |
| 2009 | 26,932 | 27,865 | 31,585 | 56,041 | 48,792 | 50,754 | 44,252 | 34,593 | 32,186 | 27,057 | 36,731 | 35,170 |
| 2010 | 56,410 | 45,816 | 37,092 | 41,555 | 36,808 | 32,521 | 36,271 | 21,580 | 28,592 | 34,064 | 31,583 | 28,718 |
| 2011 | 40,264 | 32,006 | 38,538 | 33,125 | 35,220 | 27,347 | 20,226 | 30,256 | 20,380 | 30,709 | 15,268 | 25,600 |
| 2012 | 15,808 | 20,144 | 19,271 | 7,552 | 16,212 | 8,256 | 15,358 | 19,100 | 11,501 | 10,351 | 14,210 | 16,886 |
| 2013 | 13,497 | 11,378 | 8,292 | 5,171 | 5,626 | 8,046 | 8,111 | 8,809 | 16,950 | 5,559 | 2,692 | 2,728 |
| 2014 | 8,536 | 3,824 | 2,701 | 3,006 | 2,806 | 9,800 | 6,305 | 1,567 | 5,745 | 6,973 | 0 | 8,011 |
| 2015 | 11,616 | 12,202 | 14,651 | 2,883 | 1,707 | 2,598 | 7,173 | 11,205 | 5,654 | 8,689 | 7,515 | 5,618 |
| 2016 | 12,048 | 9,728 | 8,568 | 4,767 | 5,200 | 7,638 | 5,773 | 8,082 | 2,882 | 5,753 | 9,073 | 8,854 |
| 2017 | 12,955 | 8,477 | 4,878 | 5,171 | 5,494 | 5,637 | 5,189 | 7,862 | 2,650 | 2,457 | 6,378 | 10,864 |
| 2018 | 16,640 | 6,771 | 6,473 | 3,131 | 2,653 | 2,904 | 5,602 | 5,473 | 3,154 | 6,075 | 2,805 | 14,771 |
| 2019 | 14,482 | 7,555 | 3,499 | 2,842 | 9 | 5 | 2,832 | 2,886 | 0 | 5,532 | 2,781 | 10,481 |
| 2020 | 13,218 | 5,689 | 2,860 | 3,214 | 2,811 | 4,871 | 4,083 | 2,883 | 1,241 | 8 | 2,846 | 5,489 |
| 2021 | 6,379 | 5,694 | 1,409 | 8 | 1,675 | 11 | 1,735 | 22 | 1,246 | 24 | 1,744 | 1,641 |
| 2022 | 6,456 | 4,503 | 2,649 | 151 | 645 | 178 | 2,886 | 3,052 | 160 | 208 | 1,395 | 2,983 |
| 2023 | 2,663 | 4,057 | 1,358 | 200 | 1,621 | 267 | 1,501 | 261 | 178 | 221 | 152 | 2,761 |
| 2024 | 4,339 | 2,763 | 4,692 | 45 | 29 | 28 | 49 | 65 | 2,141 | 61 | 42 | 2,226 |
| 2025 | 1,805 | 302 | 207 | 165 | 219 | 197 | 271 | |||||
| - = No Data Reported; -- = Not Applicable; NA = Not Available; W = Withheld to avoid disclosure of individual company data. |
| Release Date: 9/30/2025 |
| Next Release Date: 10/31/2025 |