|
Download Data (XLS File) |
|
||||||||
|
||||||||
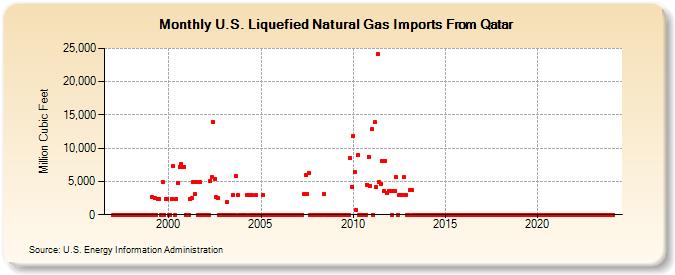
| U.S. Liquefied Natural Gas Imports From Qatar (Million Cubic Feet) | ||||||||
| Year | Jan | Feb | Mar | Apr | May | Jun | Jul | Aug | Sep | Oct | Nov | Dec |
|---|---|---|---|---|---|---|---|---|---|---|---|---|
| 1997 | 0 | 0 | 0 | 0 | 0 | 0 | 0 | 0 | 0 | 0 | 0 | 0 |
| 1998 | 0 | 0 | 0 | 0 | 0 | 0 | 0 | 0 | 0 | 0 | 0 | 0 |
| 1999 | 0 | 2,647 | 0 | 2,492 | 0 | 2,417 | 2,388 | 0 | 4,987 | 0 | 2,374 | 2,392 |
| 2000 | 0 | 0 | 2,428 | 7,254 | 0 | 2,385 | 4,793 | 7,167 | 7,625 | 7,165 | 7,241 | 0 |
| 2001 | 0 | 0 | 2,400 | 2,452 | 4,975 | 3,076 | 4,934 | 0 | 4,919 | 0 | 0 | 0 |
| 2002 | 0 | 0 | 0 | 5,030 | 5,612 | 13,903 | 5,375 | 2,644 | 2,517 | 0 | 0 | 0 |
| 2003 | 0 | 0 | 1,871 | 0 | 0 | 0 | 2,993 | 0 | 5,760 | 2,999 | 0 | 0 |
| 2004 | 0 | 0 | 0 | 2,925 | 2,999 | 0 | 2,926 | 0 | 0 | 3,004 | 0 | 0 |
| 2005 | 0 | 2,986 | 0 | 0 | 0 | 0 | 0 | 0 | 0 | 0 | 0 | 0 |
| 2006 | 0 | 0 | 0 | 0 | 0 | 0 | 0 | 0 | 0 | 0 | 0 | 0 |
| 2007 | 0 | 0 | 0 | 0 | 3,040 | 5,926 | 3,098 | 6,287 | 0 | 0 | 0 | 0 |
| 2008 | 0 | 0 | 0 | 0 | 0 | 3,108 | 0 | 0 | 0 | 0 | 0 | 0 |
| 2009 | 0 | 0 | 0 | 0 | 0 | 0 | 0 | 0 | 0 | 0 | 8,495 | 4,192 |
| 2010 | 11,901 | 6,429 | 734 | 8,946 | 0 | 0 | 0 | 0 | 0 | 4,535 | 8,750 | 4,288 |
| 2011 | 12,820 | 0 | 13,896 | 4,100 | 24,205 | 4,900 | 4,565 | 8,084 | 3,546 | 8,106 | 3,214 | 3,536 |
| 2012 | 3,521 | 0 | 3,522 | 3,515 | 5,601 | 0 | 3,012 | 3,017 | 3,017 | 5,603 | 3,015 | 0 |
| 2013 | 0 | 3,657 | 3,663 | 0 | 0 | 0 | 0 | 0 | 0 | 0 | 0 | 0 |
| 2014 | 0 | 0 | 0 | 0 | 0 | 0 | 0 | 0 | 0 | 0 | 0 | 0 |
| 2015 | 0 | 0 | 0 | 0 | 0 | 0 | 0 | 0 | 0 | 0 | 0 | 0 |
| 2016 | 0 | 0 | 0 | 0 | 0 | 0 | 0 | 0 | 0 | 0 | 0 | 0 |
| 2017 | 0 | 0 | 0 | 0 | 0 | 0 | 0 | 0 | 0 | 0 | 0 | 0 |
| 2018 | 0 | 0 | 0 | 0 | 0 | 0 | 0 | 0 | 0 | 0 | 0 | 0 |
| 2019 | 0 | 0 | 0 | 0 | 0 | 0 | 0 | 0 | 0 | 0 | 0 | 0 |
| 2020 | 0 | 0 | 0 | 0 | 0 | 0 | 0 | 0 | 0 | 0 | 0 | 0 |
| 2021 | 0 | 0 | 0 | 0 | 0 | 0 | 0 | 0 | 0 | 0 | 0 | 0 |
| 2022 | 0 | 0 | 0 | 0 | 0 | 0 | 0 | 0 | 0 | 0 | 0 | 0 |
| 2023 | 0 | 0 | 0 | 0 | 0 | 0 | 0 | 0 | 0 | 0 | 0 | 0 |
| 2024 | 0 | 0 | 0 | 0 | 0 | 0 | 0 | 0 | 0 | 0 | 0 | 0 |
| 2025 | 0 | 0 | 0 | 0 | 0 | 0 | 0 | 0 | 0 | 0 | 0 | 3,525 |
| 2026 | 0 | 0 | 0 | |||||||||
| - = No Data Reported; -- = Not Applicable; NA = Not Available; W = Withheld to avoid disclosure of individual company data. |
| Release Date: 5/29/2026 |
| Next Release Date: 6/30/2026 |