|
Download Data (XLS File) |
|
||||||||
|
||||||||
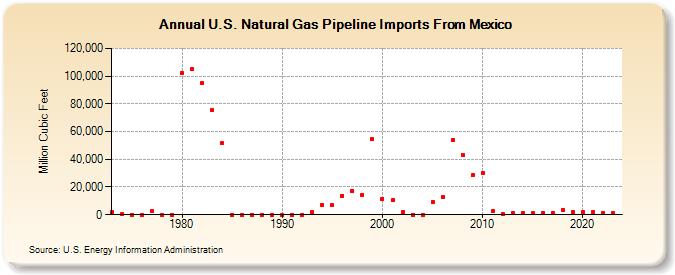
| U.S. Natural Gas Pipeline Imports From Mexico (Million Cubic Feet) | ||||||||
| Decade | Year-0 | Year-1 | Year-2 | Year-3 | Year-4 | Year-5 | Year-6 | Year-7 | Year-8 | Year-9 |
|---|---|---|---|---|---|---|---|---|---|---|
| 1970's | 1,632 | 222 | 0 | 0 | 2,384 | 0 | 0 | |||
| 1980's | 102,410 | 105,013 | 94,794 | 75,361 | 51,502 | 0 | 0 | 0 | 0 | 0 |
| 1990's | 0 | 0 | 0 | 1,678 | 7,013 | 6,722 | 13,862 | 17,243 | 14,532 | 54,530 |
| 2000's | 11,601 | 10,276 | 1,755 | 0 | 0 | 9,320 | 12,749 | 54,062 | 43,314 | 28,296 |
| 2010's | 29,995 | 2,672 | 314 | 1,069 | 1,426 | 933 | 917 | 1,346 | 3,316 | 1,873 |
| 2020's | 1,706 | 1,718 | 1,064 | 989 |
| - = No Data Reported; -- = Not Applicable; NA = Not Available; W = Withheld to avoid disclosure of individual company data. |
| Release Date: 3/29/2024 |
| Next Release Date: 4/30/2024 |