|
Download Data (XLS File) |
|
||||||||
|
||||||||
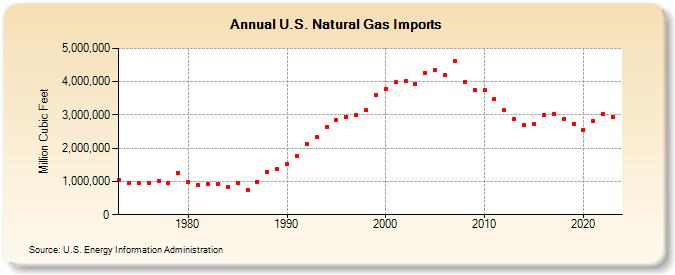
| U.S. Natural Gas Imports (Million Cubic Feet) | ||||||||
| Decade | Year-0 | Year-1 | Year-2 | Year-3 | Year-4 | Year-5 | Year-6 | Year-7 | Year-8 | Year-9 |
|---|---|---|---|---|---|---|---|---|---|---|
| 1970's | 1,032,903 | 959,285 | 953,008 | 963,768 | 1,011,002 | 965,545 | 1,253,383 | |||
| 1980's | 984,767 | 903,949 | 933,336 | 918,407 | 843,060 | 949,715 | 750,449 | 992,532 | 1,293,812 | 1,381,520 |
| 1990's | 1,532,259 | 1,773,313 | 2,137,504 | 2,350,115 | 2,623,839 | 2,841,048 | 2,937,413 | 2,994,173 | 3,152,058 | 3,585,505 |
| 2000's | 3,781,603 | 3,976,939 | 4,015,463 | 3,943,749 | 4,258,558 | 4,341,034 | 4,186,281 | 4,607,582 | 3,984,101 | 3,751,360 |
| 2010's | 3,740,757 | 3,468,693 | 3,137,789 | 2,883,355 | 2,695,378 | 2,718,094 | 3,006,497 | 3,033,226 | 2,888,847 | 2,741,717 |
| 2020's | 2,551,175 | 2,807,961 | 3,024,143 | 2,927,939 | 3,144,546 | 3,163,625 |
| - = No Data Reported; -- = Not Applicable; NA = Not Available; W = Withheld to avoid disclosure of individual company data. |
| Release Date: 6/30/2026 |
| Next Release Date: 7/31/2026 |