|
Download Data (XLS File) |
|
||||||||
|
||||||||
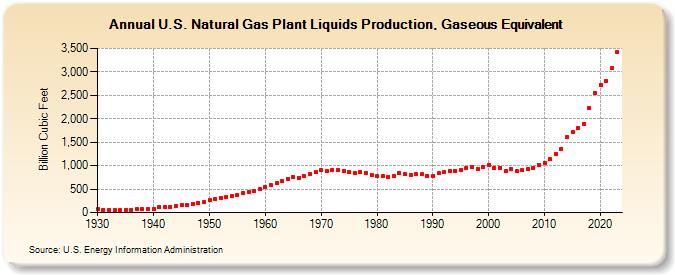
| U.S. Natural Gas Plant Liquids Production, Gaseous Equivalent (Billion Cubic Feet) | ||||||||
| Decade | Year-0 | Year-1 | Year-2 | Year-3 | Year-4 | Year-5 | Year-6 | Year-7 | Year-8 | Year-9 |
|---|---|---|---|---|---|---|---|---|---|---|
| 1930's | 75 | 62 | 52 | 48 | 52 | 55 | 61 | 70 | 73 | 74 |
| 1940's | 80 | 115 | 119 | 122 | 143 | 160 | 165 | 189 | 210 | 224 |
| 1950's | 260 | 292 | 319 | 340 | 354 | 377 | 418 | 434 | 458 | 498 |
| 1960's | 543 | 592 | 624 | 670 | 723 | 753 | 739 | 785 | 828 | 867 |
| 1970's | 906 | 883 | 908 | 917 | 887 | 872 | 854 | 863 | 852 | 808 |
| 1980's | 777 | 775 | 762 | 790 | 838 | 816 | 800 | 812 | 816 | 785 |
| 1990's | 784 | 835 | 872 | 886 | 889 | 908 | 958 | 964 | 938 | 973 |
| 2000's | 1,016 | 954 | 957 | 876 | 927 | 876 | 906 | 930 | 953 | 1,024 |
| 2010's | 1,066 | 1,134 | 1,250 | 1,357 | 1,608 | 1,707 | 1,808 | 1,897 | 2,235 | 2,548 |
| 2020's | 2,710 | 2,809 | 3,075 | 3,413 |
| - = No Data Reported; -- = Not Applicable; NA = Not Available; W = Withheld to avoid disclosure of individual company data. |
| Release Date: 3/29/2024 |
| Next Release Date: 4/30/2024 |