|
Download Data (XLS File) |
|
||||||||
|
||||||||
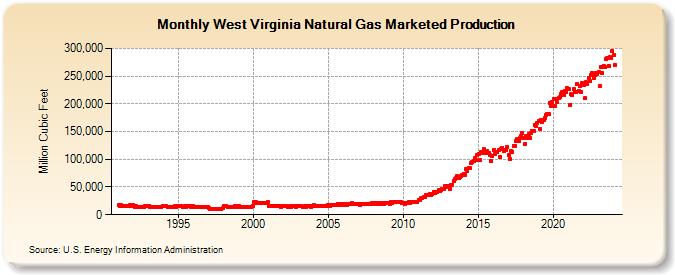
| West Virginia Natural Gas Marketed Production (Million Cubic Feet) | ||||||||
| Year | Jan | Feb | Mar | Apr | May | Jun | Jul | Aug | Sep | Oct | Nov | Dec |
|---|---|---|---|---|---|---|---|---|---|---|---|---|
| 1991 | 17,396 | 15,533 | 16,912 | 16,042 | 15,899 | 15,321 | 15,630 | 15,622 | 15,293 | 16,665 | 16,618 | 17,321 |
| 1992 | 15,753 | 14,057 | 15,030 | 14,537 | 14,654 | 14,195 | 14,489 | 14,327 | 14,169 | 15,208 | 15,064 | 15,711 |
| 1993 | 14,832 | 14,221 | 14,357 | 13,376 | 13,525 | 13,678 | 13,401 | 13,834 | 13,723 | 14,188 | 13,270 | 14,872 |
| 1994 | 15,867 | 15,214 | 15,359 | 14,310 | 14,470 | 14,633 | 14,337 | 14,800 | 14,682 | 15,179 | 14,197 | 15,910 |
| 1995 | 16,083 | 15,420 | 15,568 | 14,504 | 14,666 | 14,831 | 14,531 | 15,001 | 14,881 | 15,385 | 14,390 | 16,126 |
| 1996 | 14,678 | 14,074 | 14,208 | 13,238 | 13,385 | 13,536 | 13,262 | 13,691 | 13,581 | 14,042 | 13,133 | 14,718 |
| 1997 | 11,284 | 10,820 | 10,923 | 10,177 | 10,290 | 10,406 | 10,196 | 10,525 | 10,441 | 10,795 | 10,096 | 11,315 |
| 1998 | 15,557 | 14,916 | 15,058 | 14,030 | 14,186 | 14,346 | 14,056 | 14,510 | 14,394 | 14,882 | 13,919 | 15,598 |
| 1999 | 15,278 | 14,649 | 14,789 | 13,778 | 13,932 | 14,089 | 13,804 | 14,250 | 14,136 | 14,615 | 13,670 | 15,319 |
| 2000 | 22,824 | 21,885 | 22,093 | 20,584 | 20,813 | 21,048 | 20,622 | 21,289 | 21,119 | 21,834 | 20,422 | 22,886 |
| 2001 | 16,448 | 15,771 | 15,921 | 14,834 | 14,999 | 15,168 | 14,861 | 15,341 | 15,219 | 15,735 | 14,717 | 16,492 |
| 2002 | 16,211 | 15,543 | 15,691 | 14,620 | 14,783 | 14,949 | 14,647 | 15,120 | 14,999 | 15,508 | 14,504 | 16,254 |
| 2003 | 16,212 | 15,544 | 15,693 | 14,621 | 14,784 | 14,950 | 14,648 | 15,121 | 15,000 | 15,509 | 14,505 | 16,256 |
| 2004 | 17,107 | 16,403 | 16,559 | 15,428 | 15,600 | 15,776 | 15,457 | 15,956 | 15,829 | 16,365 | 15,306 | 17,153 |
| 2005 | 17,282 | 16,208 | 17,614 | 16,653 | 17,939 | 17,568 | 17,884 | 19,327 | 17,924 | 18,347 | 18,429 | 19,203 |
| 2006 | 18,236 | 17,116 | 18,556 | 17,535 | 18,853 | 18,480 | 18,792 | 20,282 | 18,845 | 19,296 | 19,342 | 20,197 |
| 2007 | 19,128 | 17,223 | 18,887 | 18,577 | 19,393 | 18,926 | 19,676 | 19,490 | 19,858 | 19,471 | 20,197 | 20,359 |
| 2008 | 20,532 | 19,590 | 20,545 | 19,860 | 20,394 | 20,092 | 20,886 | 21,025 | 19,722 | 21,450 | 20,426 | 20,360 |
| 2009 | 21,061 | 19,451 | 22,066 | 21,730 | 22,662 | 22,059 | 22,735 | 22,959 | 22,536 | 23,046 | 22,253 | 21,878 |
| 2010 | 21,761 | 19,902 | 21,939 | 21,408 | 22,221 | 21,823 | 22,609 | 22,617 | 22,145 | 23,288 | 22,618 | 22,843 |
| 2011 | 27,393 | 26,177 | 30,256 | 30,468 | 31,924 | 32,349 | 35,183 | 34,666 | 36,341 | 36,585 | 35,143 | 37,641 |
| 2012 | 41,446 | 39,295 | 40,921 | 40,445 | 44,374 | 42,914 | 43,972 | 47,203 | 46,122 | 51,276 | 50,463 | 51,430 |
| 2013 | 50,931 | 45,953 | 53,069 | 53,998 | 61,005 | 63,756 | 66,696 | 69,028 | 66,489 | 67,929 | 70,659 | 72,342 |
| 2014 | 73,914 | 71,648 | 82,080 | 79,244 | 84,312 | 83,597 | 92,609 | 95,588 | 96,856 | 101,552 | 98,013 | 107,701 |
| 2015 | 110,271 | 99,105 | 113,858 | 111,323 | 118,474 | 111,890 | 111,602 | 114,734 | 111,675 | 108,349 | 97,462 | 106,504 |
| 2016 | 116,943 | 109,571 | 113,695 | 112,470 | 116,018 | 104,660 | 119,034 | 121,035 | 115,466 | 117,061 | 116,843 | 121,664 |
| 2017 | 107,493 | 100,013 | 115,090 | 113,282 | 124,025 | 124,711 | 132,398 | 137,060 | 133,066 | 139,034 | 141,574 | 146,533 |
| 2018 | 139,078 | 128,051 | 142,753 | 138,895 | 145,816 | 138,591 | 147,210 | 151,702 | 151,037 | 162,154 | 160,248 | 166,164 |
| 2019 | 169,050 | 154,910 | 171,516 | 167,816 | 171,305 | 174,784 | 180,524 | 181,927 | 181,334 | 201,814 | 196,055 | 204,178 |
| 2020 | 208,588 | 196,895 | 209,172 | 202,679 | 210,899 | 211,505 | 218,262 | 220,852 | 216,528 | 223,615 | 220,490 | 228,506 |
| 2021 | 226,357 | 198,404 | 217,550 | 215,237 | 226,230 | 220,743 | 221,714 | 234,964 | 224,034 | 231,720 | 221,495 | 236,698 |
| 2022 | 234,795 | 209,707 | 239,344 | 235,580 | 247,179 | 240,568 | 251,625 | 255,603 | 245,734 | 251,647 | 255,298 | 253,533 |
| 2023 | 256,931 | 231,585 | 266,638 | 256,029 | 268,279 | 266,083 | 279,996 | 282,678 | 268,946 | 284,310 | 282,583 | 295,123 |
| 2024 | 288,010 | |||||||||||
| - = No Data Reported; -- = Not Applicable; NA = Not Available; W = Withheld to avoid disclosure of individual company data. |
| Release Date: 3/29/2024 |
| Next Release Date: 4/30/2024 |