|
Download Data (XLS File) |
|
||||||||
|
||||||||
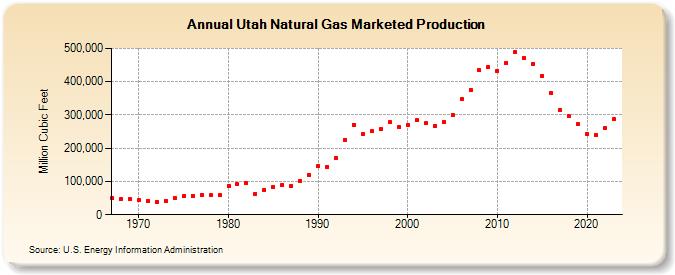
| Utah Natural Gas Marketed Production (Million Cubic Feet) | ||||||||
| Decade | Year-0 | Year-1 | Year-2 | Year-3 | Year-4 | Year-5 | Year-6 | Year-7 | Year-8 | Year-9 |
|---|---|---|---|---|---|---|---|---|---|---|
| 1960's | 48,965 | 46,151 | 46,733 | |||||||
| 1970's | 42,781 | 42,418 | 39,474 | 42,715 | 50,522 | 55,354 | 57,416 | 60,696 | 58,416 | 58,605 |
| 1980's | 87,766 | 91,191 | 94,255 | 63,158 | 74,698 | 83,405 | 90,013 | 87,158 | 101,372 | 120,089 |
| 1990's | 145,875 | 144,817 | 171,293 | 225,401 | 270,858 | 241,290 | 250,767 | 257,139 | 277,340 | 262,614 |
| 2000's | 269,285 | 283,913 | 274,739 | 268,058 | 277,969 | 301,223 | 348,320 | 376,409 | 433,566 | 444,162 |
| 2010's | 432,045 | 457,525 | 490,393 | 470,863 | 454,545 | 417,020 | 365,268 | 315,211 | 295,826 | 271,808 |
| 2020's | 241,965 | 239,422 | 260,192 | 286,643 |
| - = No Data Reported; -- = Not Applicable; NA = Not Available; W = Withheld to avoid disclosure of individual company data. |
| Release Date: 3/29/2024 |
| Next Release Date: 4/30/2024 |