|
Download Data (XLS File) |
|
||||||||
|
||||||||
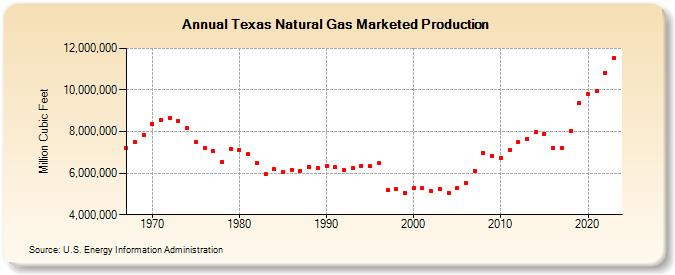
| Texas Natural Gas Marketed Production (Million Cubic Feet) | ||||||||
| Decade | Year-0 | Year-1 | Year-2 | Year-3 | Year-4 | Year-5 | Year-6 | Year-7 | Year-8 | Year-9 |
|---|---|---|---|---|---|---|---|---|---|---|
| 1960's | 7,188,900 | 7,495,414 | 7,853,199 | |||||||
| 1970's | 8,357,716 | 8,550,705 | 8,657,840 | 8,513,850 | 8,170,798 | 7,485,764 | 7,191,859 | 7,051,027 | 6,548,184 | 7,174,623 |
| 1980's | 7,115,889 | 6,910,021 | 6,468,817 | 5,938,561 | 6,185,021 | 6,052,663 | 6,151,775 | 6,126,315 | 6,286,029 | 6,241,425 |
| 1990's | 6,343,146 | 6,280,654 | 6,145,862 | 6,249,624 | 6,353,844 | 6,330,048 | 6,470,620 | 5,167,334 | 5,227,477 | 5,054,486 |
| 2000's | 5,282,104 | 5,282,723 | 5,141,075 | 5,243,567 | 5,067,315 | 5,276,401 | 5,548,022 | 6,123,180 | 6,960,693 | 6,818,973 |
| 2010's | 6,715,294 | 7,112,863 | 7,475,495 | 7,633,618 | 7,985,019 | 7,890,459 | 7,225,472 | 7,223,841 | 8,041,010 | 9,378,489 |
| 2020's | 9,813,035 | 9,949,156 | 10,828,515 | 11,542,821 |
| - = No Data Reported; -- = Not Applicable; NA = Not Available; W = Withheld to avoid disclosure of individual company data. |
| Release Date: 3/29/2024 |
| Next Release Date: 4/30/2024 |