|
Download Data (XLS File) |
|
||||||||
|
||||||||
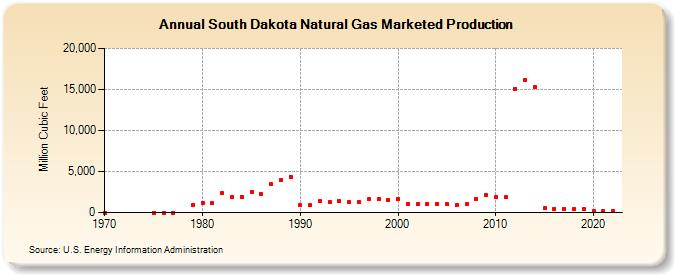
| South Dakota Natural Gas Marketed Production (Million Cubic Feet) | ||||||||
| Decade | Year-0 | Year-1 | Year-2 | Year-3 | Year-4 | Year-5 | Year-6 | Year-7 | Year-8 | Year-9 |
|---|---|---|---|---|---|---|---|---|---|---|
| 1970's | 0 | 0 | 0 | 0 | 914 | |||||
| 1980's | 1,193 | 1,155 | 2,331 | 1,846 | 1,947 | 2,558 | 2,231 | 3,431 | 3,920 | 4,369 |
| 1990's | 881 | 882 | 1,456 | 1,306 | 1,437 | 1,252 | 1,329 | 1,598 | 1,620 | 1,566 |
| 2000's | 1,652 | 1,100 | 1,025 | 1,103 | 1,093 | 992 | 963 | 995 | 1,644 | 2,129 |
| 2010's | 1,862 | 1,848 | 15,085 | 16,205 | 15,305 | 553 | 455 | 476 | 447 | 414 |
| 2020's | 160 | 161 | 165 |
| - = No Data Reported; -- = Not Applicable; NA = Not Available; W = Withheld to avoid disclosure of individual company data. |
| Release Date: 8/30/2024 |
| Next Release Date: 9/30/2024 |