|
Download Data (XLS File) |
|
||||||||
|
||||||||
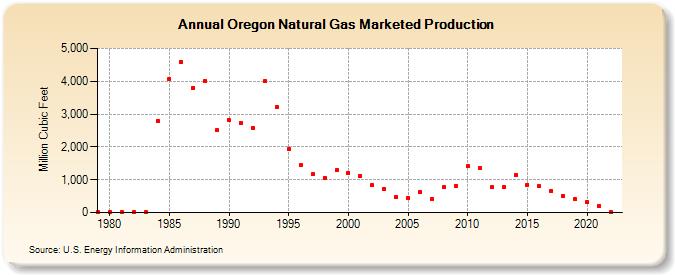
| Oregon Natural Gas Marketed Production (Million Cubic Feet) | ||||||||
| Decade | Year-0 | Year-1 | Year-2 | Year-3 | Year-4 | Year-5 | Year-6 | Year-7 | Year-8 | Year-9 |
|---|---|---|---|---|---|---|---|---|---|---|
| 1970's | 2 | |||||||||
| 1980's | 5 | 5 | 3 | 3 | 2,790 | 4,080 | 4,600 | 3,800 | 4,000 | 2,500 |
| 1990's | 2,815 | 2,741 | 2,580 | 4,003 | 3,221 | 1,923 | 1,439 | 1,173 | 1,067 | 1,291 |
| 2000's | 1,214 | 1,110 | 837 | 731 | 467 | 454 | 621 | 409 | 778 | 821 |
| 2010's | 1,407 | 1,344 | 770 | 770 | 1,142 | 848 | 801 | 659 | 499 | 399 |
| 2020's | 320 | 205 | 13 |
| - = No Data Reported; -- = Not Applicable; NA = Not Available; W = Withheld to avoid disclosure of individual company data. |
| Release Date: 3/29/2024 |
| Next Release Date: 4/30/2024 |