|
Download Data (XLS File) |
|
||||||||
|
||||||||
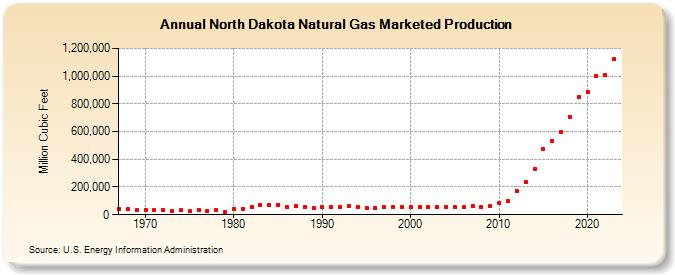
| North Dakota Natural Gas Marketed Production (Million Cubic Feet) | ||||||||
| Decade | Year-0 | Year-1 | Year-2 | Year-3 | Year-4 | Year-5 | Year-6 | Year-7 | Year-8 | Year-9 |
|---|---|---|---|---|---|---|---|---|---|---|
| 1960's | 40,462 | 41,023 | 33,587 | |||||||
| 1970's | 34,889 | 33,864 | 32,472 | 27,703 | 31,206 | 24,786 | 31,470 | 29,173 | 30,499 | 18,468 |
| 1980's | 42,346 | 42,573 | 53,818 | 69,319 | 70,496 | 72,633 | 55,098 | 62,258 | 57,747 | 51,174 |
| 1990's | 52,169 | 53,479 | 54,883 | 59,851 | 57,805 | 49,468 | 49,674 | 52,401 | 53,185 | 52,862 |
| 2000's | 52,426 | 54,732 | 57,048 | 55,693 | 55,009 | 52,557 | 55,273 | 60,255 | 52,444 | 59,369 |
| 2010's | 81,837 | 97,102 | 172,242 | 235,711 | 326,491 | 471,360 | 531,997 | 593,998 | 706,552 | 850,826 |
| 2020's | 887,445 | 999,094 | 1,007,621 | 1,120,244 |
| - = No Data Reported; -- = Not Applicable; NA = Not Available; W = Withheld to avoid disclosure of individual company data. |
| Release Date: 3/29/2024 |
| Next Release Date: 4/30/2024 |