|
Download Data (XLS File) |
|
||||||||
|
||||||||
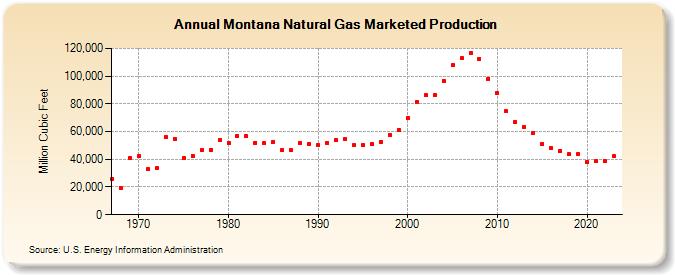
| Montana Natural Gas Marketed Production (Million Cubic Feet) | ||||||||
| Decade | Year-0 | Year-1 | Year-2 | Year-3 | Year-4 | Year-5 | Year-6 | Year-7 | Year-8 | Year-9 |
|---|---|---|---|---|---|---|---|---|---|---|
| 1960's | 25,866 | 19,313 | 41,229 | |||||||
| 1970's | 42,705 | 32,720 | 33,474 | 56,175 | 54,873 | 40,734 | 42,563 | 46,819 | 46,522 | 53,888 |
| 1980's | 51,867 | 56,565 | 56,517 | 51,967 | 51,474 | 52,494 | 46,592 | 46,456 | 51,654 | 51,307 |
| 1990's | 50,429 | 51,999 | 53,867 | 54,528 | 50,416 | 50,264 | 50,996 | 52,437 | 57,645 | 61,163 |
| 2000's | 69,936 | 81,397 | 86,075 | 86,027 | 96,762 | 107,918 | 112,845 | 116,848 | 112,529 | 98,245 |
| 2010's | 87,539 | 74,624 | 66,954 | 63,242 | 59,160 | 51,356 | 47,921 | 46,311 | 43,530 | 43,534 |
| 2020's | 38,191 | 38,719 | 39,778 | 41,172 | 43,095 |
| - = No Data Reported; -- = Not Applicable; NA = Not Available; W = Withheld to avoid disclosure of individual company data. |
| Release Date: 10/31/2025 |
| Next Release Date: 11/28/2025 |