|
Download Data (XLS File) |
|
||||||||
|
||||||||
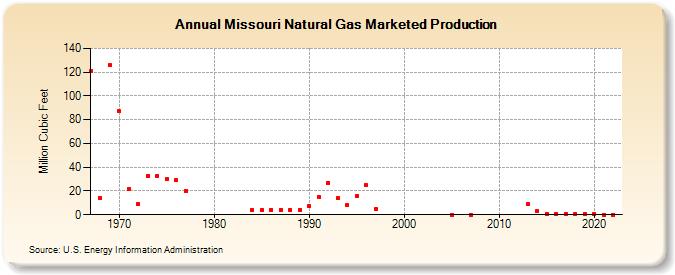
| Missouri Natural Gas Marketed Production (Million Cubic Feet) | ||||||||
| Decade | Year-0 | Year-1 | Year-2 | Year-3 | Year-4 | Year-5 | Year-6 | Year-7 | Year-8 | Year-9 |
|---|---|---|---|---|---|---|---|---|---|---|
| 1960's | 121 | 14 | 126 | |||||||
| 1970's | 87 | 22 | 9 | 33 | 33 | 30 | 29 | 20 | ||
| 1980's | 4 | 4 | 4 | 4 | 4 | 4 | ||||
| 1990's | 7 | 15 | 27 | 14 | 8 | 16 | 25 | 5 | ||
| 2000's | 0 | 0 | NA | NA | ||||||
| 2010's | NA | NA | NA | 9 | 3 | 1 | 1 | 1 | 1 | 1 |
| 2020's | 1 | 0 | 0 |
| - = No Data Reported; -- = Not Applicable; NA = Not Available; W = Withheld to avoid disclosure of individual company data. |
| Release Date: 3/29/2024 |
| Next Release Date: 4/30/2024 |