|
Download Data (XLS File) |
|
||||||||
|
||||||||
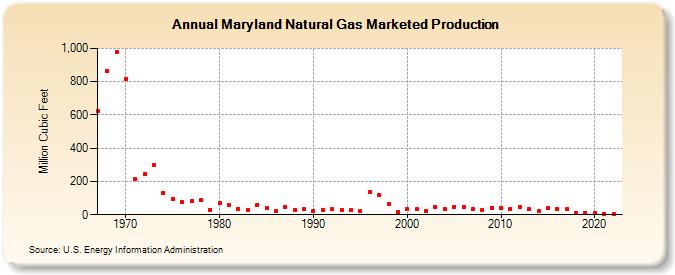
| Maryland Natural Gas Marketed Production (Million Cubic Feet) | ||||||||
| Decade | Year-0 | Year-1 | Year-2 | Year-3 | Year-4 | Year-5 | Year-6 | Year-7 | Year-8 | Year-9 |
|---|---|---|---|---|---|---|---|---|---|---|
| 1960's | 621 | 864 | 978 | |||||||
| 1970's | 813 | 214 | 244 | 298 | 133 | 93 | 75 | 82 | 88 | 28 |
| 1980's | 68 | 56 | 36 | 31 | 60 | 39 | 20 | 44 | 29 | 34 |
| 1990's | 22 | 29 | 33 | 28 | 26 | 22 | 135 | 118 | 63 | 18 |
| 2000's | 34 | 32 | 22 | 48 | 34 | 46 | 48 | 35 | 28 | 43 |
| 2010's | 43 | 34 | 44 | 32 | 20 | 38 | 34 | 32 | 13 | 13 |
| 2020's | 10 | 5 | 5 |
| - = No Data Reported; -- = Not Applicable; NA = Not Available; W = Withheld to avoid disclosure of individual company data. |
| Release Date: 3/29/2024 |
| Next Release Date: 4/30/2024 |