|
Download Data (XLS File) |
|
||||||||
|
||||||||
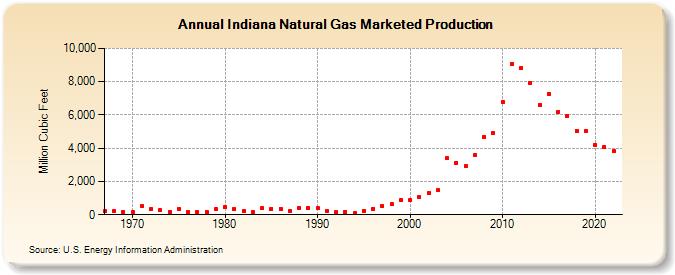
| Indiana Natural Gas Marketed Production (Million Cubic Feet) | ||||||||
| Decade | Year-0 | Year-1 | Year-2 | Year-3 | Year-4 | Year-5 | Year-6 | Year-7 | Year-8 | Year-9 |
|---|---|---|---|---|---|---|---|---|---|---|
| 1960's | 198 | 234 | 171 | |||||||
| 1970's | 153 | 537 | 355 | 276 | 176 | 346 | 192 | 183 | 163 | 350 |
| 1980's | 463 | 330 | 233 | 135 | 394 | 367 | 365 | 217 | 412 | 416 |
| 1990's | 399 | 232 | 174 | 192 | 107 | 249 | 360 | 526 | 615 | 855 |
| 2000's | 899 | 1,064 | 1,309 | 1,464 | 3,401 | 3,135 | 2,921 | 3,606 | 4,701 | 4,927 |
| 2010's | 6,802 | 9,075 | 8,814 | 7,938 | 6,616 | 7,250 | 6,205 | 5,914 | 5,054 | 5,044 |
| 2020's | 4,197 | 4,063 | 3,836 |
| - = No Data Reported; -- = Not Applicable; NA = Not Available; W = Withheld to avoid disclosure of individual company data. |
| Release Date: 4/30/2024 |
| Next Release Date: 5/31/2024 |