|
Download Data (XLS File) |
|
||||||||
|
||||||||
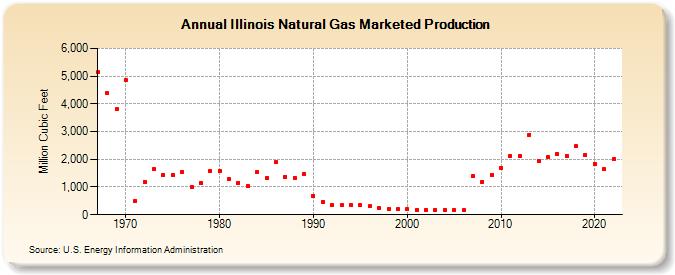
| Illinois Natural Gas Marketed Production (Million Cubic Feet) | ||||||||
| Decade | Year-0 | Year-1 | Year-2 | Year-3 | Year-4 | Year-5 | Year-6 | Year-7 | Year-8 | Year-9 |
|---|---|---|---|---|---|---|---|---|---|---|
| 1960's | 5,144 | 4,380 | 3,800 | |||||||
| 1970's | 4,850 | 498 | 1,194 | 1,638 | 1,436 | 1,440 | 1,556 | 1,003 | 1,159 | 1,585 |
| 1980's | 1,574 | 1,295 | 1,162 | 1,030 | 1,530 | 1,324 | 1,887 | 1,371 | 1,338 | 1,477 |
| 1990's | 677 | 466 | 347 | 340 | 333 | 335 | 298 | 231 | 209 | 195 |
| 2000's | 189 | 185 | 180 | 174 | 170 | 166 | 170 | 1,394 | 1,193 | 1,443 |
| 2010's | 1,702 | 2,121 | 2,125 | 2,887 | 1,929 | 2,080 | 2,183 | 2,131 | 2,464 | 2,150 |
| 2020's | 1,840 | 1,637 | 2,003 | 2,588 | 3,191 |
| - = No Data Reported; -- = Not Applicable; NA = Not Available; W = Withheld to avoid disclosure of individual company data. |
| Release Date: 2/6/2026 |
| Next Release Date: 2/27/2026 |