|
Download Data (XLS File) |
|
||||||||
|
||||||||
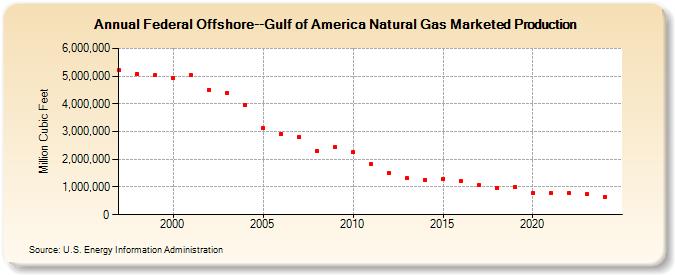
| Federal Offshore--Gulf of America Natural Gas Marketed Production (Million Cubic Feet) | ||||||||
| Decade | Year-0 | Year-1 | Year-2 | Year-3 | Year-4 | Year-5 | Year-6 | Year-7 | Year-8 | Year-9 |
|---|---|---|---|---|---|---|---|---|---|---|
| 1990's | 5,206,023 | 5,076,496 | 5,029,704 | |||||||
| 2000's | 4,934,387 | 5,027,623 | 4,511,942 | 4,406,450 | 3,969,450 | 3,132,089 | 2,901,969 | 2,798,718 | 2,314,342 | 2,428,916 |
| 2010's | 2,245,062 | 1,812,328 | 1,507,564 | 1,309,246 | 1,253,678 | 1,291,945 | 1,200,669 | 1,060,452 | 974,863 | 1,015,343 |
| 2020's | 791,491 | 780,632 | 770,477 | 736,307 | 670,182 | 706,233 |
| - = No Data Reported; -- = Not Applicable; NA = Not Available; W = Withheld to avoid disclosure of individual company data. |
| Release Date: 5/29/2026 |
| Next Release Date: 6/30/2026 |