|
Download Data (XLS File) |
|
||||||||
|
||||||||
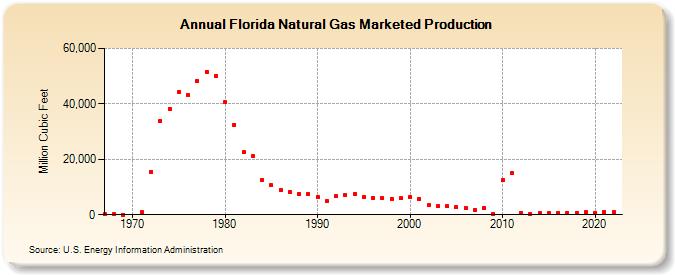
| Florida Natural Gas Marketed Production (Million Cubic Feet) | ||||||||
| Decade | Year-0 | Year-1 | Year-2 | Year-3 | Year-4 | Year-5 | Year-6 | Year-7 | Year-8 | Year-9 |
|---|---|---|---|---|---|---|---|---|---|---|
| 1960's | 123 | 108 | 50 | |||||||
| 1970's | 903 | 15,521 | 33,857 | 38,137 | 44,383 | 43,165 | 48,171 | 51,595 | 50,190 | |
| 1980's | 40,638 | 32,470 | 22,515 | 21,056 | 12,585 | 10,545 | 8,833 | 8,281 | 7,484 | 7,534 |
| 1990's | 6,483 | 4,884 | 6,657 | 7,085 | 7,486 | 6,463 | 6,006 | 6,114 | 5,796 | 5,933 |
| 2000's | 6,491 | 5,710 | 3,353 | 3,087 | 3,123 | 2,616 | 2,540 | 1,778 | 2,436 | 257 |
| 2010's | 12,409 | 15,125 | 773 | 292 | 496 | 764 | 716 | 708 | 788 | 854 |
| 2020's | 700 | 888 | 849 |
| - = No Data Reported; -- = Not Applicable; NA = Not Available; W = Withheld to avoid disclosure of individual company data. |
| Release Date: 3/29/2024 |
| Next Release Date: 4/30/2024 |