|
Download Data (XLS File) |
|
||||||||
|
||||||||
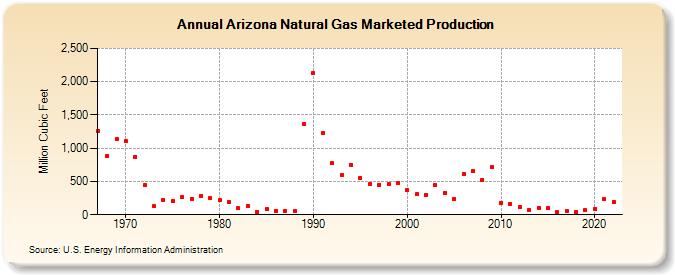
| Arizona Natural Gas Marketed Production (Million Cubic Feet) | ||||||||
| Decade | Year-0 | Year-1 | Year-2 | Year-3 | Year-4 | Year-5 | Year-6 | Year-7 | Year-8 | Year-9 |
|---|---|---|---|---|---|---|---|---|---|---|
| 1960's | 1,255 | 881 | 1,136 | |||||||
| 1970's | 1,101 | 868 | 442 | 125 | 224 | 208 | 262 | 240 | 286 | 247 |
| 1980's | 214 | 187 | 99 | 132 | 45 | 85 | 63 | 60 | 56 | 1,360 |
| 1990's | 2,125 | 1,225 | 771 | 597 | 752 | 558 | 463 | 452 | 457 | 474 |
| 2000's | 368 | 307 | 301 | 443 | 331 | 233 | 611 | 655 | 523 | 712 |
| 2010's | 183 | 168 | 117 | 72 | 106 | 95 | 47 | 56 | 42 | 66 |
| 2020's | 87 | 229 | 198 |
| - = No Data Reported; -- = Not Applicable; NA = Not Available; W = Withheld to avoid disclosure of individual company data. |
| Release Date: 4/30/2024 |
| Next Release Date: 5/31/2024 |