|
Download Data (XLS File) |
|
||||||||
|
||||||||
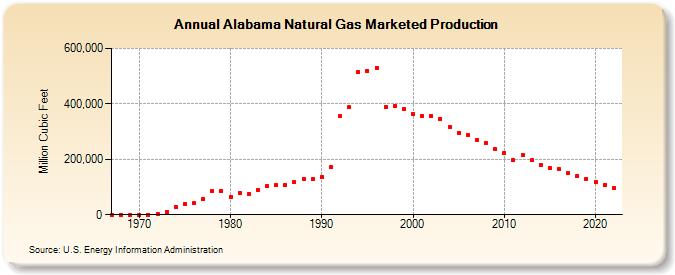
| Alabama Natural Gas Marketed Production (Million Cubic Feet) | ||||||||
| Decade | Year-0 | Year-1 | Year-2 | Year-3 | Year-4 | Year-5 | Year-6 | Year-7 | Year-8 | Year-9 |
|---|---|---|---|---|---|---|---|---|---|---|
| 1960's | 248 | 230 | 180 | |||||||
| 1970's | 627 | 355 | 3,644 | 11,271 | 27,865 | 37,814 | 41,427 | 57,227 | 85,599 | 85,815 |
| 1980's | 65,294 | 79,244 | 75,003 | 90,801 | 101,821 | 107,342 | 107,184 | 117,241 | 129,524 | 128,411 |
| 1990's | 135,276 | 170,847 | 355,099 | 388,024 | 515,272 | 519,661 | 530,841 | 388,596 | 392,394 | 381,701 |
| 2000's | 363,467 | 356,810 | 356,061 | 346,145 | 316,021 | 296,528 | 286,220 | 270,407 | 257,884 | 236,029 |
| 2010's | 222,932 | 195,581 | 215,710 | 196,326 | 181,060 | 168,246 | 164,815 | 150,038 | 139,477 | 130,069 |
| 2020's | 117,030 | 107,233 | 95,790 |
| - = No Data Reported; -- = Not Applicable; NA = Not Available; W = Withheld to avoid disclosure of individual company data. |
| Release Date: 3/29/2024 |
| Next Release Date: 4/30/2024 |