|
Download Data (XLS File) |
|
||||||||
|
||||||||
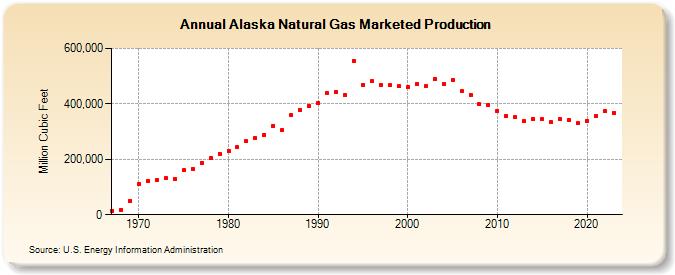
| Alaska Natural Gas Marketed Production (Million Cubic Feet) | ||||||||
| Decade | Year-0 | Year-1 | Year-2 | Year-3 | Year-4 | Year-5 | Year-6 | Year-7 | Year-8 | Year-9 |
|---|---|---|---|---|---|---|---|---|---|---|
| 1960's | 14,438 | 17,343 | 50,864 | |||||||
| 1970's | 111,576 | 121,618 | 125,596 | 131,007 | 128,935 | 160,270 | 166,072 | 187,889 | 203,088 | 220,754 |
| 1980's | 230,588 | 242,564 | 264,364 | 276,691 | 289,129 | 321,346 | 304,841 | 359,837 | 378,638 | 393,729 |
| 1990's | 402,907 | 437,822 | 443,597 | 430,350 | 555,402 | 469,550 | 480,828 | 468,311 | 466,648 | 462,967 |
| 2000's | 458,995 | 471,440 | 463,301 | 489,757 | 471,899 | 487,282 | 444,724 | 433,485 | 398,442 | 397,077 |
| 2010's | 374,226 | 356,225 | 351,259 | 338,182 | 345,310 | 343,625 | 332,749 | 344,385 | 341,315 | 329,361 |
| 2020's | 339,337 | 354,660 | 373,145 | 367,729 | 371,876 | 368,956 |
| - = No Data Reported; -- = Not Applicable; NA = Not Available; W = Withheld to avoid disclosure of individual company data. |
| Release Date: 4/30/2026 |
| Next Release Date: 5/29/2026 |