|
Download Data (XLS File) |
|
||||||||
|
||||||||
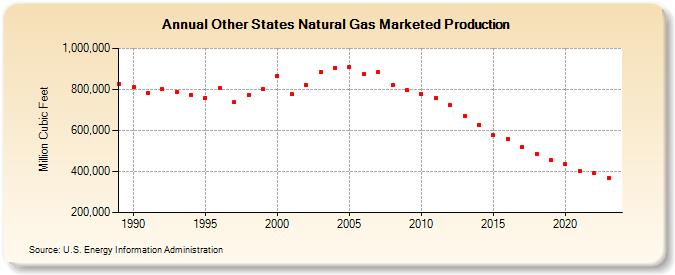
| Other States Natural Gas Marketed Production (Million Cubic Feet) | ||||||||
| Decade | Year-0 | Year-1 | Year-2 | Year-3 | Year-4 | Year-5 | Year-6 | Year-7 | Year-8 | Year-9 |
|---|---|---|---|---|---|---|---|---|---|---|
| 1980's | 826,576 | |||||||||
| 1990's | 810,100 | 784,362 | 800,913 | 788,472 | 774,724 | 759,728 | 805,491 | 736,679 | 775,235 | 800,579 |
| 2000's | 866,902 | 776,303 | 820,849 | 884,232 | 906,075 | 907,965 | 875,830 | 885,582 | 819,635 | 795,531 |
| 2010's | 777,957 | 758,219 | 722,721 | 671,364 | 628,854 | 577,660 | 559,985 | 517,698 | 485,675 | 456,024 |
| 2020's | 435,117 | 401,892 | 391,046 | 369,584 |
| - = No Data Reported; -- = Not Applicable; NA = Not Available; W = Withheld to avoid disclosure of individual company data. |
| Release Date: 3/29/2024 |
| Next Release Date: 4/30/2024 |