|
Download Data (XLS File) |
|
||||||||
|
||||||||
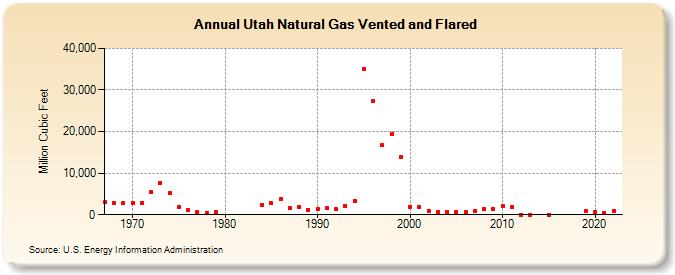
| Utah Natural Gas Vented and Flared (Million Cubic Feet) | ||||||||
| Decade | Year-0 | Year-1 | Year-2 | Year-3 | Year-4 | Year-5 | Year-6 | Year-7 | Year-8 | Year-9 |
|---|---|---|---|---|---|---|---|---|---|---|
| 1960's | 3,000 | 2,906 | 2,802 | |||||||
| 1970's | 2,852 | 2,926 | 5,506 | 7,664 | 5,259 | 1,806 | 1,048 | 691 | 469 | 560 |
| 1980's | 2,439 | 2,740 | 3,682 | 1,572 | 1,766 | 1,161 | ||||
| 1990's | 1,338 | 1,625 | 1,284 | 2,153 | 3,363 | 35,069 | 27,277 | 16,790 | 19,365 | 13,835 |
| 2000's | 1,941 | 1,847 | 955 | 705 | 688 | 595 | 585 | 1,005 | 1,285 | 1,398 |
| 2010's | 2,080 | 1,755 | 0 | 0 | NA | 0 | NA | NA | NA | 944 |
| 2020's | 595 | 529 | 1,004 |
| - = No Data Reported; -- = Not Applicable; NA = Not Available; W = Withheld to avoid disclosure of individual company data. |
| Release Date: 3/29/2024 |
| Next Release Date: 4/30/2024 |