|
Download Data (XLS File) |
|
||||||||
|
||||||||
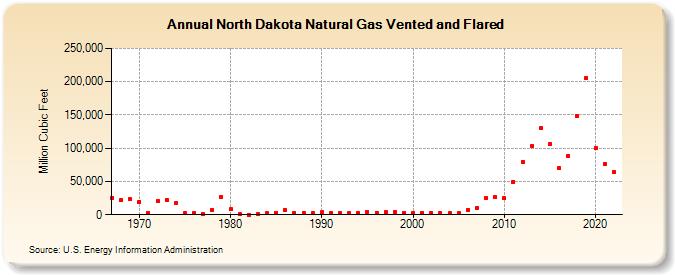
| North Dakota Natural Gas Vented and Flared (Million Cubic Feet) | ||||||||
| Decade | Year-0 | Year-1 | Year-2 | Year-3 | Year-4 | Year-5 | Year-6 | Year-7 | Year-8 | Year-9 |
|---|---|---|---|---|---|---|---|---|---|---|
| 1960's | 25,795 | 22,050 | 22,955 | |||||||
| 1970's | 19,862 | 2,686 | 20,786 | 22,533 | 17,860 | 2,155 | 2,737 | 1,116 | 6,788 | 26,932 |
| 1980's | 7,975 | 698 | 1 | 996 | 2,018 | 2,984 | 6,853 | 2,771 | 2,771 | 2,050 |
| 1990's | 3,642 | 2,603 | 2,197 | 2,337 | 2,492 | 4,300 | 2,957 | 3,534 | 4,371 | 2,693 |
| 2000's | 3,290 | 3,166 | 2,791 | 2,070 | 2,198 | 3,260 | 7,460 | 10,500 | 25,700 | 26,876 |
| 2010's | 24,582 | 49,652 | 79,564 | 102,855 | 129,717 | 106,565 | 70,045 | 88,555 | 148,501 | 205,278 |
| 2020's | 99,532 | 76,459 | 63,998 | 61,802 |
| - = No Data Reported; -- = Not Applicable; NA = Not Available; W = Withheld to avoid disclosure of individual company data. |
| Release Date: 2025/07/31 |
| Next Release Date: 2025/08/29 |