|
Download Data (XLS File) |
|
||||||||
|
||||||||
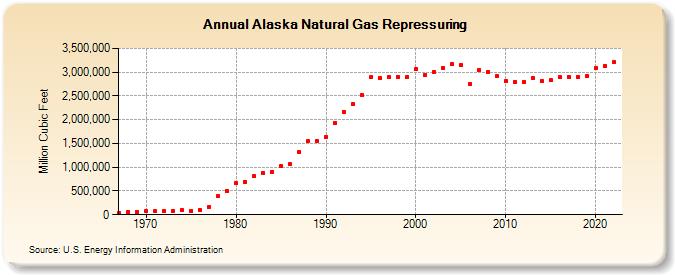
| Alaska Natural Gas Repressuring (Million Cubic Feet) | ||||||||
| Decade | Year-0 | Year-1 | Year-2 | Year-3 | Year-4 | Year-5 | Year-6 | Year-7 | Year-8 | Year-9 |
|---|---|---|---|---|---|---|---|---|---|---|
| 1960's | 39,989 | 57,702 | 66,240 | |||||||
| 1970's | 71,470 | 72,674 | 75,719 | 87,302 | 89,504 | 82,556 | 96,485 | 170,258 | 385,254 | 507,710 |
| 1980's | 658,351 | 694,865 | 813,421 | 882,884 | 905,571 | 1,015,911 | 1,061,351 | 1,319,430 | 1,545,391 | 1,561,498 |
| 1990's | 1,639,689 | 1,930,290 | 2,168,019 | 2,325,506 | 2,517,259 | 2,891,618 | 2,885,686 | 2,904,370 | 2,904,028 | 2,892,017 |
| 2000's | 3,062,853 | 2,948,652 | 3,006,824 | 3,082,204 | 3,166,098 | 3,149,237 | 2,753,901 | 3,039,347 | 3,007,418 | 2,908,828 |
| 2010's | 2,812,701 | 2,795,732 | 2,801,763 | 2,869,956 | 2,816,681 | 2,826,291 | 2,888,903 | 2,898,778 | 2,905,187 | 2,913,744 |
| 2020's | 3,085,278 | 3,125,427 | 3,206,628 |
| - = No Data Reported; -- = Not Applicable; NA = Not Available; W = Withheld to avoid disclosure of individual company data. |
| Release Date: 3/29/2024 |
| Next Release Date: 4/30/2024 |