|
Download Data (XLS File) |
|
||||||||
|
||||||||
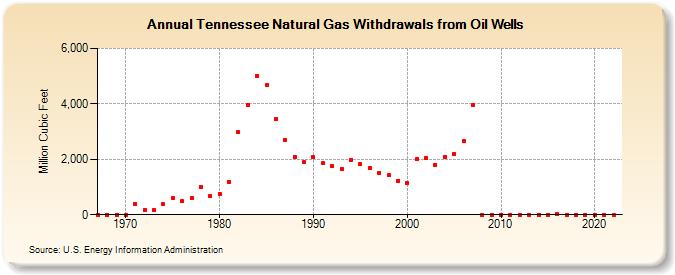
| Tennessee Natural Gas Withdrawals from Oil Wells (Million Cubic Feet) | ||||||||
| Decade | Year-0 | Year-1 | Year-2 | Year-3 | Year-4 | Year-5 | Year-6 | Year-7 | Year-8 | Year-9 |
|---|---|---|---|---|---|---|---|---|---|---|
| 1960's | 0 | 0 | 0 | |||||||
| 1970's | 0 | 398 | 180 | 165 | 376 | 585 | 485 | 592 | 1,014 | 664 |
| 1980's | 763 | 1,198 | 2,976 | 3,950 | 5,022 | 4,686 | 3,464 | 2,707 | 2,100 | 1,900 |
| 1990's | 2,067 | 1,856 | 1,770 | 1,660 | 1,990 | 1,820 | 1,690 | 1,510 | 1,420 | 1,230 |
| 2000's | 1,150 | 2,000 | 2,050 | 1,803 | 2,100 | 2,200 | 2,663 | 3,942 | 0 | 0 |
| 2010's | 0 | 0 | 0 | 0 | 0 | 0 | 15 | 0 | 0 | 0 |
| 2020's | 0 | 0 | 0 |
| - = No Data Reported; -- = Not Applicable; NA = Not Available; W = Withheld to avoid disclosure of individual company data. |
| Release Date: 4/30/2024 |
| Next Release Date: 5/31/2024 |