|
Download Data (XLS File) |
|
||||||||
|
||||||||
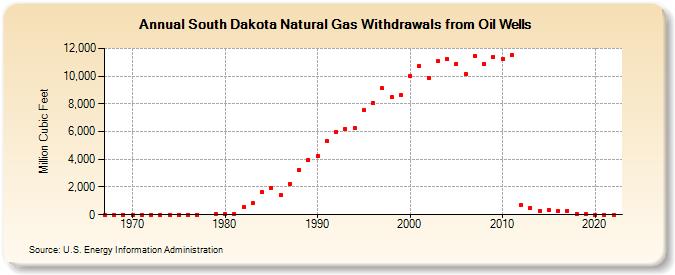
| South Dakota Natural Gas Withdrawals from Oil Wells (Million Cubic Feet) | ||||||||
| Decade | Year-0 | Year-1 | Year-2 | Year-3 | Year-4 | Year-5 | Year-6 | Year-7 | Year-8 | Year-9 |
|---|---|---|---|---|---|---|---|---|---|---|
| 1960's | 0 | 0 | 0 | |||||||
| 1970's | 0 | 9 | 0 | 0 | 0 | 0 | 0 | 0 | 58 | |
| 1980's | 55 | 52 | 539 | 844 | 1,649 | 1,934 | 1,398 | 2,237 | 3,248 | 3,947 |
| 1990's | 4,233 | 5,315 | 5,957 | 6,204 | 6,264 | 7,526 | 8,061 | 9,107 | 8,480 | 8,637 |
| 2000's | 10,032 | 10,751 | 9,894 | 11,055 | 11,238 | 10,902 | 10,162 | 11,458 | 10,909 | 11,366 |
| 2010's | 11,240 | 11,516 | 689 | 512 | 299 | 335 | 264 | 297 | 34 | 36 |
| 2020's | 0 | 0 | 0 |
| - = No Data Reported; -- = Not Applicable; NA = Not Available; W = Withheld to avoid disclosure of individual company data. |
| Release Date: 8/30/2024 |
| Next Release Date: 9/30/2024 |