|
Download Data (XLS File) |
|
||||||||
|
||||||||
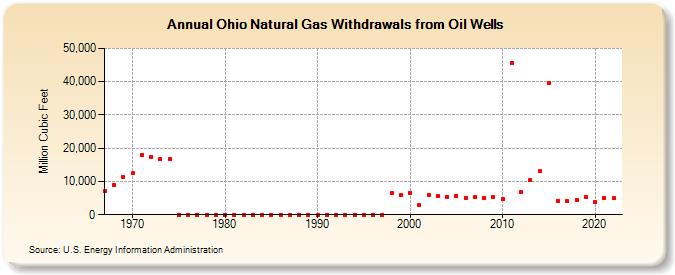
| Ohio Natural Gas Withdrawals from Oil Wells (Million Cubic Feet) | ||||||||
| Decade | Year-0 | Year-1 | Year-2 | Year-3 | Year-4 | Year-5 | Year-6 | Year-7 | Year-8 | Year-9 |
|---|---|---|---|---|---|---|---|---|---|---|
| 1960's | 7,024 | 8,931 | 11,253 | |||||||
| 1970's | 12,419 | 18,058 | 17,230 | 16,679 | 16,749 | 0 | 0 | 0 | 0 | 0 |
| 1980's | 0 | 0 | 0 | 0 | 0 | 0 | 0 | 0 | 0 | 0 |
| 1990's | 0 | 0 | 0 | 0 | 0 | 0 | 0 | 0 | 6,541 | 5,968 |
| 2000's | 6,574 | 2,835 | 6,004 | 5,647 | 5,458 | 5,704 | 5,160 | 5,268 | 5,072 | 5,301 |
| 2010's | 4,651 | 45,663 | 6,684 | 10,317 | 13,022 | 39,466 | 4,181 | 3,982 | 4,432 | 5,294 |
| 2020's | 3,860 | 5,059 | 4,926 |
| - = No Data Reported; -- = Not Applicable; NA = Not Available; W = Withheld to avoid disclosure of individual company data. |
| Release Date: 3/29/2024 |
| Next Release Date: 4/30/2024 |