|
Download Data (XLS File) |
|
||||||||
|
||||||||
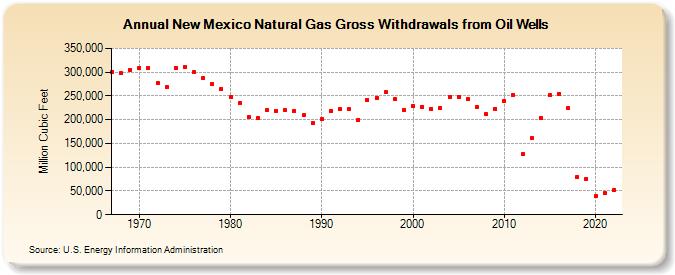
| New Mexico Natural Gas Gross Withdrawals from Oil Wells (Million Cubic Feet) | ||||||||
| Decade | Year-0 | Year-1 | Year-2 | Year-3 | Year-4 | Year-5 | Year-6 | Year-7 | Year-8 | Year-9 |
|---|---|---|---|---|---|---|---|---|---|---|
| 1960's | 301,003 | 297,313 | 305,073 | |||||||
| 1970's | 309,118 | 308,880 | 277,294 | 268,930 | 309,784 | 311,830 | 300,161 | 287,139 | 274,098 | 264,946 |
| 1980's | 247,881 | 235,176 | 205,439 | 202,587 | 219,537 | 218,909 | 219,487 | 218,630 | 209,253 | 192,717 |
| 1990's | 200,716 | 217,852 | 222,303 | 221,560 | 200,041 | 242,247 | 246,559 | 257,365 | 243,458 | 219,900 |
| 2000's | 229,437 | 227,534 | 222,940 | 224,263 | 246,804 | 248,352 | 242,989 | 227,352 | 211,496 | 223,493 |
| 2010's | 238,580 | 252,326 | 127,009 | 160,649 | 204,342 | 251,149 | 254,940 | 224,149 | 78,929 | 75,978 |
| 2020's | 38,497 | 44,709 | 52,675 |
| - = No Data Reported; -- = Not Applicable; NA = Not Available; W = Withheld to avoid disclosure of individual company data. |
| Release Date: 3/29/2024 |
| Next Release Date: 4/30/2024 |