|
Download Data (XLS File) |
|
||||||||
|
||||||||
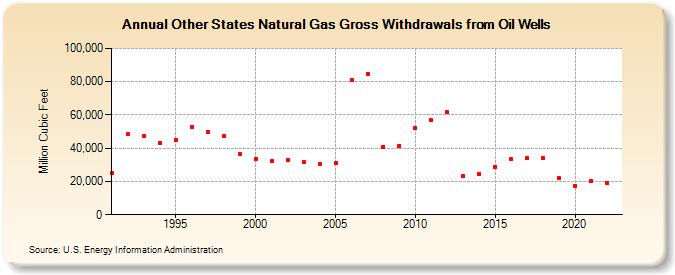
| Other States Natural Gas Gross Withdrawals from Oil Wells (Million Cubic Feet) | ||||||||
| Decade | Year-0 | Year-1 | Year-2 | Year-3 | Year-4 | Year-5 | Year-6 | Year-7 | Year-8 | Year-9 |
|---|---|---|---|---|---|---|---|---|---|---|
| 1990's | 25,002 | 48,717 | 47,617 | 43,118 | 44,755 | 52,511 | 49,973 | 47,168 | 36,679 | |
| 2000's | 33,657 | 32,338 | 32,815 | 31,903 | 30,251 | 30,906 | 81,209 | 84,762 | 40,749 | 41,553 |
| 2010's | 52,171 | 56,829 | 61,520 | 23,391 | 24,541 | 28,838 | 33,337 | 34,081 | 34,032 | 21,943 |
| 2020's | 17,474 | 20,253 | 19,003 |
| - = No Data Reported; -- = Not Applicable; NA = Not Available; W = Withheld to avoid disclosure of individual company data. |
| Release Date: 3/29/2024 |
| Next Release Date: 4/30/2024 |