|
Download Data (XLS File) |
|
||||||||
|
||||||||
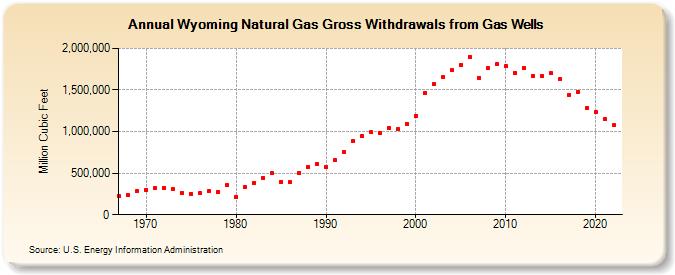
| Wyoming Natural Gas Gross Withdrawals from Gas Wells (Million Cubic Feet) | ||||||||
| Decade | Year-0 | Year-1 | Year-2 | Year-3 | Year-4 | Year-5 | Year-6 | Year-7 | Year-8 | Year-9 |
|---|---|---|---|---|---|---|---|---|---|---|
| 1960's | 221,850 | 237,156 | 280,572 | |||||||
| 1970's | 301,310 | 319,097 | 321,368 | 305,315 | 265,918 | 249,882 | 262,692 | 280,588 | 276,427 | 352,011 |
| 1980's | 214,609 | 336,051 | 381,364 | 442,762 | 498,237 | 397,601 | 389,230 | 503,899 | 572,392 | 613,966 |
| 1990's | 570,879 | 652,659 | 751,693 | 880,596 | 949,343 | 988,671 | 981,115 | 1,043,797 | 1,029,403 | 1,091,320 |
| 2000's | 1,188,657 | 1,467,331 | 1,572,728 | 1,652,504 | 1,736,136 | 1,803,443 | 1,900,589 | 1,649,284 | 1,764,084 | 1,806,807 |
| 2010's | 1,787,599 | 1,709,218 | 1,762,095 | 1,673,667 | 1,668,749 | 1,698,167 | 1,626,335 | 1,444,668 | 1,481,356 | 1,284,614 |
| 2020's | 1,236,649 | 1,146,873 | 1,074,715 |
| - = No Data Reported; -- = Not Applicable; NA = Not Available; W = Withheld to avoid disclosure of individual company data. |
| Release Date: 3/29/2024 |
| Next Release Date: 4/30/2024 |