|
Download Data (XLS File) |
|
||||||||
|
||||||||
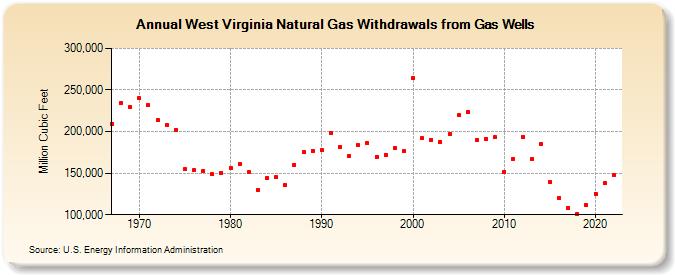
| West Virginia Natural Gas Withdrawals from Gas Wells (Million Cubic Feet) | ||||||||
| Decade | Year-0 | Year-1 | Year-2 | Year-3 | Year-4 | Year-5 | Year-6 | Year-7 | Year-8 | Year-9 |
|---|---|---|---|---|---|---|---|---|---|---|
| 1960's | 209,545 | 234,361 | 229,815 | |||||||
| 1970's | 239,787 | 232,205 | 213,845 | 207,702 | 202,306 | 154,484 | 153,322 | 152,767 | 148,564 | 150,505 |
| 1980's | 156,551 | 161,251 | 150,850 | 130,078 | 143,730 | 144,883 | 135,431 | 160,000 | 174,942 | 177,192 |
| 1990's | 178,000 | 198,605 | 182,000 | 171,024 | 183,773 | 186,231 | 169,839 | 172,268 | 180,000 | 176,015 |
| 2000's | 264,139 | 191,889 | 190,249 | 187,723 | 197,217 | 219,411 | 223,800 | 189,968 | 191,444 | 192,896 |
| 2010's | 151,401 | 167,113 | 193,537 | 167,118 | 185,005 | 139,609 | 120,393 | 108,112 | 100,767 | 111,568 |
| 2020's | 125,508 | 137,665 | 147,636 |
| - = No Data Reported; -- = Not Applicable; NA = Not Available; W = Withheld to avoid disclosure of individual company data. |
| Release Date: 3/29/2024 |
| Next Release Date: 4/30/2024 |