|
Download Data (XLS File) |
|
||||||||
|
||||||||
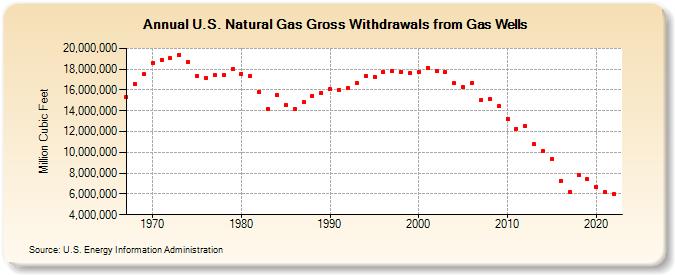
| U.S. Natural Gas Gross Withdrawals from Gas Wells (Million Cubic Feet) | ||||||||
| Decade | Year-0 | Year-1 | Year-2 | Year-3 | Year-4 | Year-5 | Year-6 | Year-7 | Year-8 | Year-9 |
|---|---|---|---|---|---|---|---|---|---|---|
| 1960's | 15,345,422 | 16,539,925 | 17,489,415 | |||||||
| 1970's | 18,594,658 | 18,925,136 | 19,042,592 | 19,371,600 | 18,669,212 | 17,380,293 | 17,190,655 | 17,415,983 | 17,394,213 | 18,033,879 |
| 1980's | 17,572,526 | 17,336,862 | 15,808,845 | 14,152,863 | 15,512,543 | 14,535,369 | 14,153,787 | 14,806,962 | 15,467,023 | 15,708,861 |
| 1990's | 16,053,566 | 16,017,626 | 16,164,874 | 16,691,139 | 17,351,060 | 17,282,032 | 17,737,334 | 17,844,046 | 17,728,520 | 17,590,187 |
| 2000's | 17,726,056 | 18,129,408 | 17,794,858 | 17,693,053 | 16,669,139 | 16,246,904 | 16,691,061 | 14,991,891 | 15,134,644 | 14,414,287 |
| 2010's | 13,247,498 | 12,291,070 | 12,504,227 | 10,759,545 | 10,123,418 | 9,371,281 | 7,287,858 | 6,161,420 | 7,864,063 | 7,433,288 |
| 2020's | 6,643,356 | 6,144,863 | 5,964,006 | 5,614,377 | 5,509,405 |
| - = No Data Reported; -- = Not Applicable; NA = Not Available; W = Withheld to avoid disclosure of individual company data. |
| Release Date: 2/6/2026 |
| Next Release Date: 2/27/2026 |