|
Download Data (XLS File) |
|
||||||||
|
||||||||
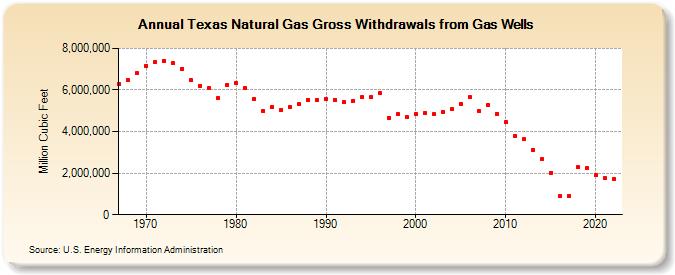
| Texas Natural Gas Gross Withdrawals from Gas Wells (Million Cubic Feet) | ||||||||
| Decade | Year-0 | Year-1 | Year-2 | Year-3 | Year-4 | Year-5 | Year-6 | Year-7 | Year-8 | Year-9 |
|---|---|---|---|---|---|---|---|---|---|---|
| 1960's | 6,280,148 | 6,477,441 | 6,800,882 | |||||||
| 1970's | 7,165,388 | 7,327,186 | 7,409,894 | 7,282,804 | 7,029,873 | 6,463,095 | 6,213,395 | 6,090,074 | 5,612,336 | 6,262,643 |
| 1980's | 6,322,180 | 6,085,714 | 5,566,472 | 4,988,179 | 5,196,636 | 5,059,681 | 5,189,688 | 5,305,442 | 5,518,260 | 5,523,698 |
| 1990's | 5,574,740 | 5,538,692 | 5,406,256 | 5,474,559 | 5,643,577 | 5,660,153 | 5,843,635 | 4,673,258 | 4,831,122 | 4,691,102 |
| 2000's | 4,853,336 | 4,897,366 | 4,828,188 | 4,947,589 | 5,074,067 | 5,331,776 | 5,649,784 | 4,992,042 | 5,285,458 | 4,860,377 |
| 2010's | 4,441,188 | 3,794,952 | 3,619,901 | 3,115,409 | 2,672,326 | 2,018,855 | 897,854 | 878,525 | 2,280,578 | 2,243,859 |
| 2020's | 1,903,361 | 1,753,103 | 1,719,330 |
| - = No Data Reported; -- = Not Applicable; NA = Not Available; W = Withheld to avoid disclosure of individual company data. |
| Release Date: 3/29/2024 |
| Next Release Date: 4/30/2024 |