|
Download Data (XLS File) |
|
||||||||
|
||||||||
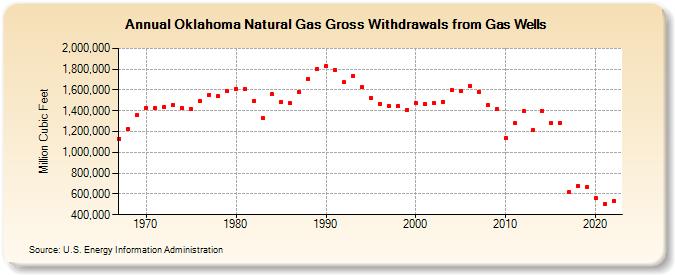
| Oklahoma Natural Gas Gross Withdrawals from Gas Wells (Million Cubic Feet) | ||||||||
| Decade | Year-0 | Year-1 | Year-2 | Year-3 | Year-4 | Year-5 | Year-6 | Year-7 | Year-8 | Year-9 |
|---|---|---|---|---|---|---|---|---|---|---|
| 1960's | 1,133,163 | 1,225,620 | 1,356,766 | |||||||
| 1970's | 1,429,408 | 1,425,847 | 1,435,726 | 1,455,293 | 1,425,283 | 1,412,637 | 1,491,165 | 1,554,799 | 1,539,176 | 1,587,935 |
| 1980's | 1,613,584 | 1,605,256 | 1,493,009 | 1,329,549 | 1,557,729 | 1,486,126 | 1,471,153 | 1,582,709 | 1,705,643 | 1,801,763 |
| 1990's | 1,830,380 | 1,794,138 | 1,674,405 | 1,732,997 | 1,626,858 | 1,521,857 | 1,467,695 | 1,450,118 | 1,446,288 | 1,409,934 |
| 2000's | 1,473,792 | 1,466,833 | 1,476,204 | 1,487,451 | 1,597,915 | 1,592,524 | 1,640,389 | 1,583,356 | 1,452,148 | 1,413,759 |
| 2010's | 1,140,111 | 1,281,794 | 1,394,859 | 1,210,315 | 1,402,378 | 1,285,128 | 1,282,996 | 615,285 | 680,763 | 671,046 |
| 2020's | 558,065 | 504,971 | 533,960 |
| - = No Data Reported; -- = Not Applicable; NA = Not Available; W = Withheld to avoid disclosure of individual company data. |
| Release Date: 3/29/2024 |
| Next Release Date: 4/30/2024 |